Sign-up below* for a virtual training session led by one of our Customer Success experts.
Reserve your spot today!
*If you are an Enterprise or Professional account member, please contact your Customer Success Manager or support@rosalind.bio to schedule a live, tailored training session for your team.
3-Step Guided Training Modules To Prepare You For Experiment Set Up Through Results Interpretation. Select Your Assay And Module Type To Get Started.
Use our demo data to learn from RCC Files or Normalized Counts or follow along with your own files.
Use our demo data to learn from Processed Counts or follow along with your own files.
Walkthroughs for quick assistance in experiment set up and navigation. For video tutorials, see our Video Library.
Step 1: Create a new Project folder by clicking ![]() . Enter a Title and Description (both can be edited at a later time).
. Enter a Title and Description (both can be edited at a later time).
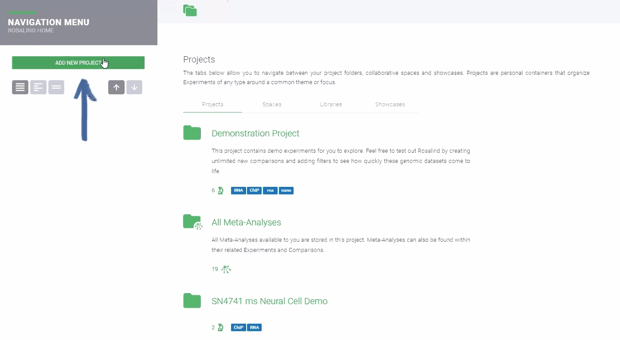
Click the ![]() button to proceed and automatically create a new Experiment.
button to proceed and automatically create a new Experiment.
Alternatively, click on an existing Project folder to open it. Then create a new Experiment by clicking ![]() . Click the
. Click the ![]() button to proceed.
button to proceed.
Step 2: Select "Design a New Experiment" to access all available assay workflows, then click Next.

Step 3: Enter an "Experiment Title" and "Description" (both can be edited at a later time), then click Next.
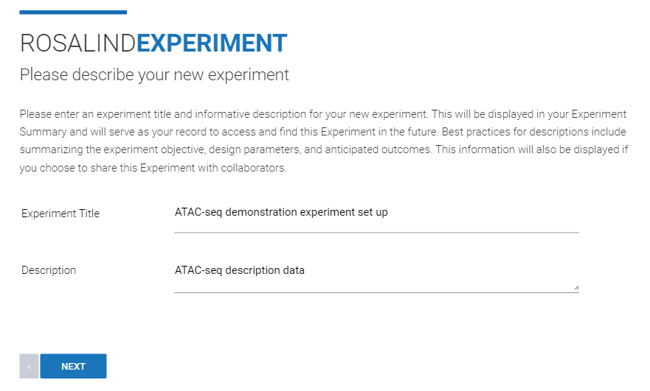
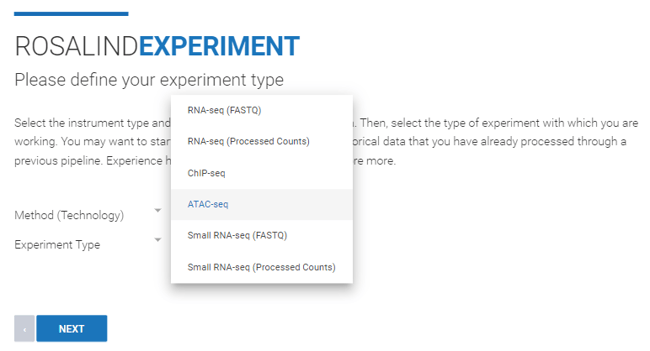
Step 4: Use the "Method (Technology)" drop down menu to select "Sequence". From the "Experiment Type" drop down menu, select "ATAC-seq". Then click Next.
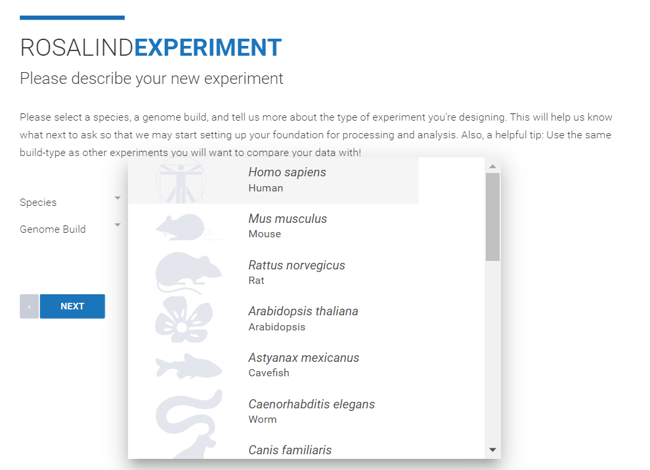
Step 5: Select the Species and Genome Build from the dropdown menus. ROSALIND offers genome builds from NCBI and Ensembl. Unless comparing the experiment to historic data, it is recommended to select the most recent build from your preferred source (NCBI or Ensembl). Click Next.
Step 6: Select the "Kit Vendor" and "Kit Model" from the dropdown menus. If you are unsure which kit was used for the experiment, contact your service provider to obtain that information. If the name of the kit is not listed, reach out to ROSALIND Support at support@rosalind.bio for guidance, or select "Other" to run a generic, unstranded analysis.
Click ![]() to confirm the selection, and ensure both a "Sample Kit" and "Library Kit" are registered to continue. An "Auxiliary Kit" or "Homebrew" option is also available.
to confirm the selection, and ensure both a "Sample Kit" and "Library Kit" are registered to continue. An "Auxiliary Kit" or "Homebrew" option is also available.

Click Next.
Step 7: From the drop down menu, indicate if the Experiment contains samples that are biological replicates ("Yes" or "No"). Enter the "Total number of samples" in the Experiment. Click Next.
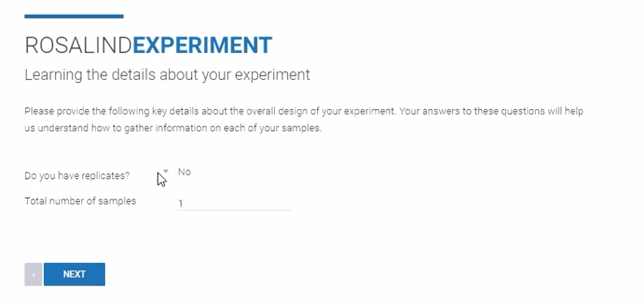
Step 8: Specify sample attributes by typing the attribute categories into the "Enter Attributes" line.
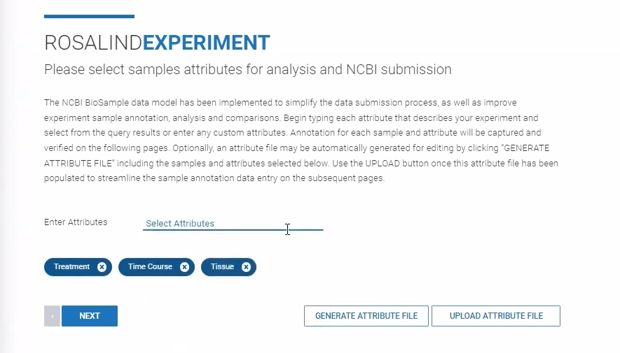
After entering attribute categories, download an attribute file (.CSV format) by clicking ![]() . Within the file, attribute values can be manually assigned to each sample. The file can then be uploaded into ROSALIND by clicking
. Within the file, attribute values can be manually assigned to each sample. The file can then be uploaded into ROSALIND by clicking ![]() . Further instructions for attribute file creation can be found here.
. Further instructions for attribute file creation can be found here.
Click Next.
Step 9: ROSALIND displays a sample sheet to review for accuracy. Optionally, values for "Laboratory Identifier" and/or "Tube/Plate Barcode" can be added for internal tracking. Once reviewed, click Next.
Step 10: Indicate which samples are part of the same replicate group. This is optional though recommended to visually enhance attribute tracking. Select the drop down menu adjacent to each sample to assign replicate group membership. As replicates are assigned, replicate groups will change to coordinating colors for visual tracking. Once all replicates are assigned, click Next.
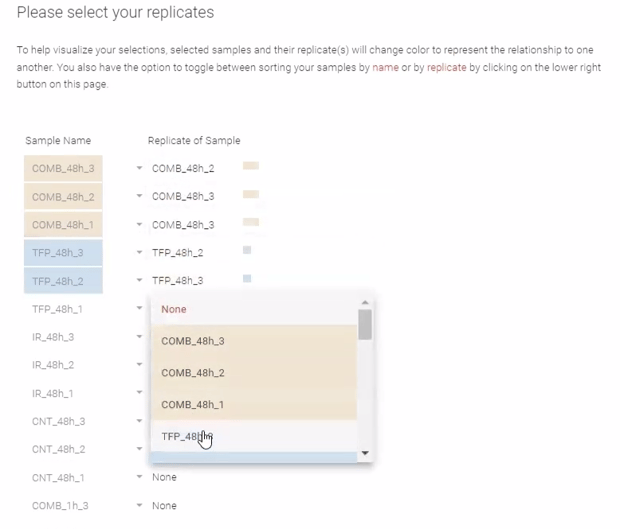
Step 11: Replicate group membership can also be used for attribute changes and tracking. If an error is noted and an edit is made, this edit will be applied to all samples in the same replicate group, reducing time for edits and risk of error.
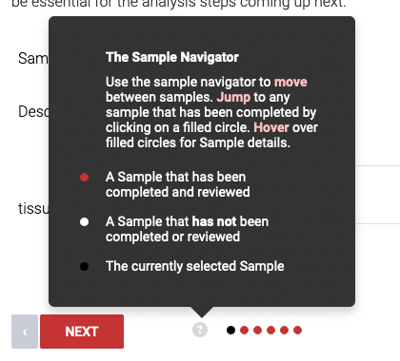
Click "Next" to review attribute information for each sample, one-by-one, or click the last red dot on the right side to skip to the last sample. Click Next to proceed to Final Sample Review.
Step 12: Final sample review can be displayed in a standard table or in a table with replicate group coloring applied. Use the "Colored By" drop down menu and select "Replicates" to turn on group coloring, if desired.

After reviewing the sample information, click ![]() to confirm that the information is correct.
to confirm that the information is correct.
Step 13: Comparisons can be configured now, prior to launching the analysis, or after the experiment has been processed and QC has been reviewed. To create a new comparison now, click ![]() . Comparisons can be created at the replicate group level (using the attributes) or individual sample level (using the sample names) by dragging and dropping different attributes or samples into the condition and control boxes on the right side of the page. Combinations of two or more different attributes can be used to create comparisons with specific subsets of samples.
. Comparisons can be created at the replicate group level (using the attributes) or individual sample level (using the sample names) by dragging and dropping different attributes or samples into the condition and control boxes on the right side of the page. Combinations of two or more different attributes can be used to create comparisons with specific subsets of samples.
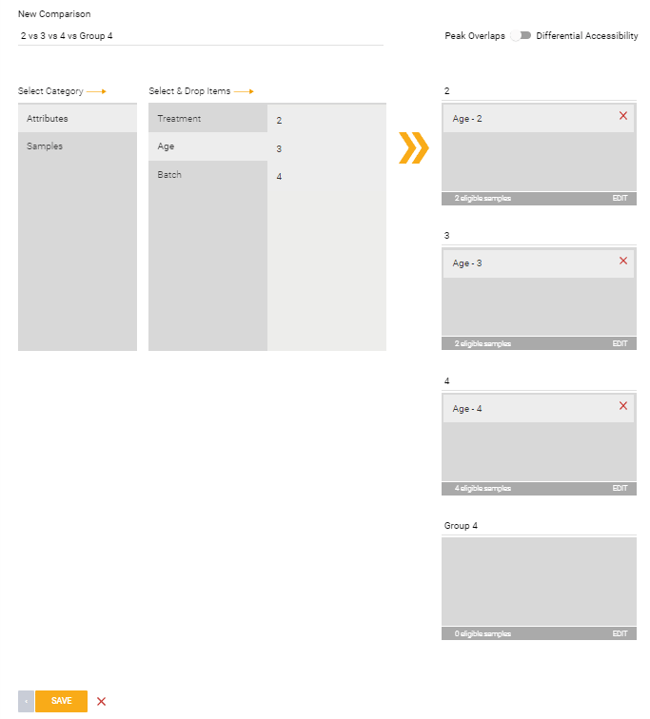
Comparison creation can be toggled between Peaks Overlap or Differential Accessibility.

Peaks Overlap:
If you’re setting up a peaks overlap comparison, up to four comparison groups can be added by clicking ![]() underneath the Control group. A group can be deleted by clicking the minus icon that appears to the right of the group on hover. You can also edit the name of any group by clicking on it.
underneath the Control group. A group can be deleted by clicking the minus icon that appears to the right of the group on hover. You can also edit the name of any group by clicking on it.
Differential Accessibility:
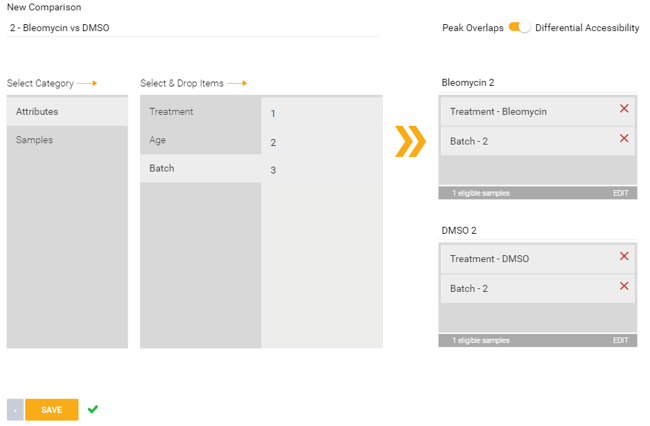
This option will compare the differential accessibility between two conditions. This can also be used within Meta-Analysis.
In the example image below, a comparison is set up across two treatment groups (Bleomycin vs DMSO) within a specific batch (batch 2).
Click the ![]() button to save the created comparison. Once all comparisons have been saved, click Next.
button to save the created comparison. Once all comparisons have been saved, click Next.
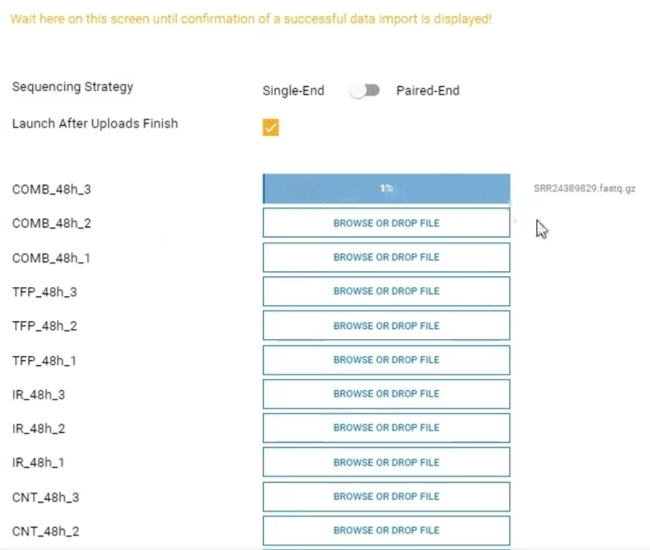
Step 14: Lastly, upload the FASTQ files (in FASTQ, GZ, or GZIP format). Toggle between "Single-End" (one file per sample) or "Paired-End" reads (left and right read per sample) according to the sequencing strategy of your experiment. Then click the file upload box adjacent to each sample name to navigate to and select the corresponding files. Alternatively, drag and drop the files into the corresponding boxes to initiate file upload. Do not close or navigate away from the page until upload of all files is complete. After successful upload of all files, the experiment will launch. ROSALIND will notify you via email once the processing is complete and your experiment is ready for exploration.
Step 1: Create a new Project folder by clicking ![]() . Enter a Title and Description (both can be edited at a later time).
. Enter a Title and Description (both can be edited at a later time).

Click the ![]() button to proceed and automatically create a new Experiment.
button to proceed and automatically create a new Experiment.
Alternatively, click on an existing Project folder to open it. Then create a new Experiment by clicking ![]() . Click the
. Click the ![]() button to proceed.
button to proceed.
Step 2: Select "Design a New Experiment" to access all available assay workflows, then click Next.

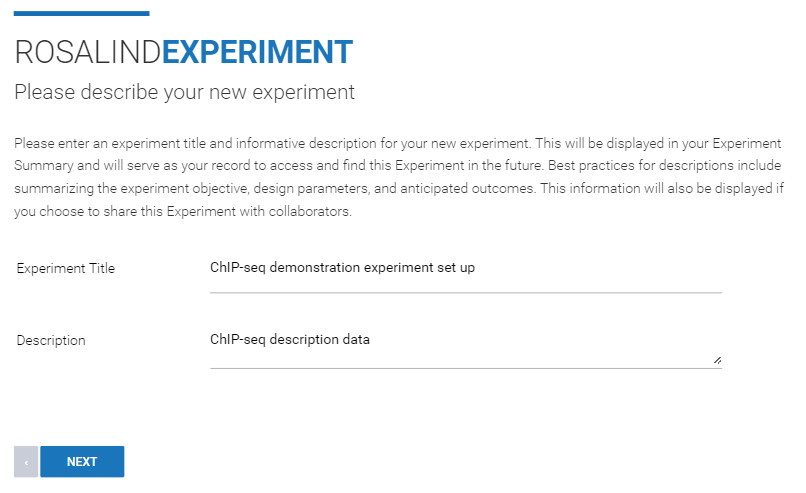
Step 3: Enter an "Experiment Title" and "Description" (both can be edited at a later time), then click Next.
Step 4: Use the "Method (Technology)" drop down menu to select "Sequence". From the "Experiment Type" drop down menu, select "ChIP-seq". Then click Next.
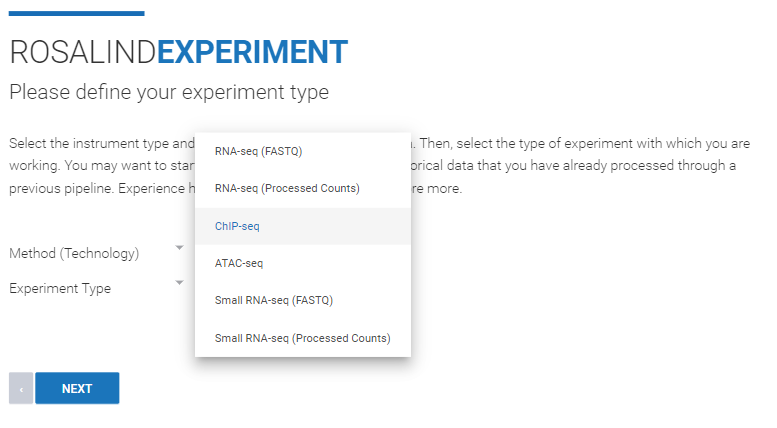
Step 5: Select the Species and Genome Build from the dropdown menus. ROSALIND offers genome builds from NCBI and Ensembl. Unless comparing the experiment to historic data, it is recommended to select the most recent build from your preferred source (NCBI or Ensembl). Click Next.

Step 6: Select the "Kit Vendor" and "Kit Model" from the dropdown menus. If you are unsure which kit was used for the experiment, contact your service provider to obtain that information. If the name of the kit is not listed, reach out to ROSALIND Support at support@rosalind.bio for guidance, or select "Other" to run a generic, unstranded analysis.
Click ![]() to confirm the selection, and ensure both a "Sample Kit" and "Library Kit" are registered to continue. An "Auxiliary Kit" or "Homebrew" option is also available.
to confirm the selection, and ensure both a "Sample Kit" and "Library Kit" are registered to continue. An "Auxiliary Kit" or "Homebrew" option is also available.

Click Next.
Step 7: From the drop down menu, indicate if the Experiment contains samples that are biological replicates ("Yes" or "No"), input or IgG controls ("Yes" or "No"), and the total number of antibodies and samples. There can be a total of up to 100 antibodies in your experiment. Click Next.
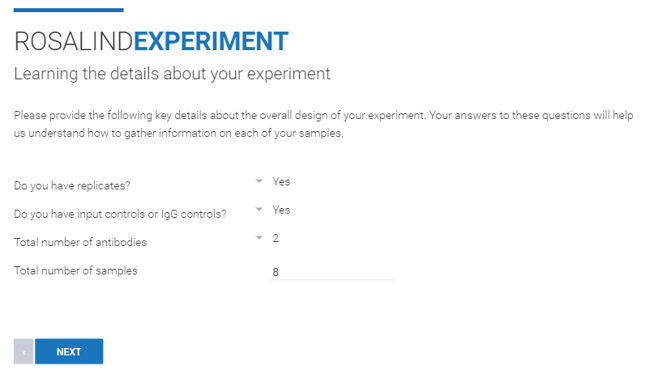
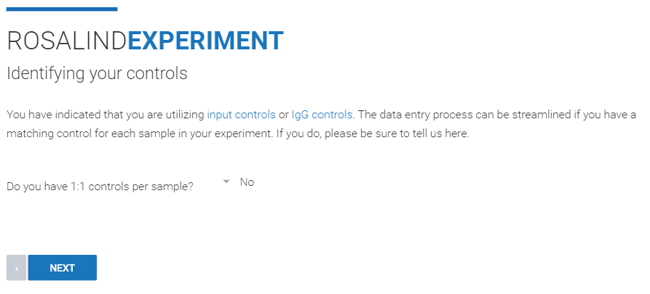
Step 8: If your experiment contains input or IgG controls, indicate whether or not you have 1:1 controls per sample. If there are no input or IgG controls, this step will be skipped.
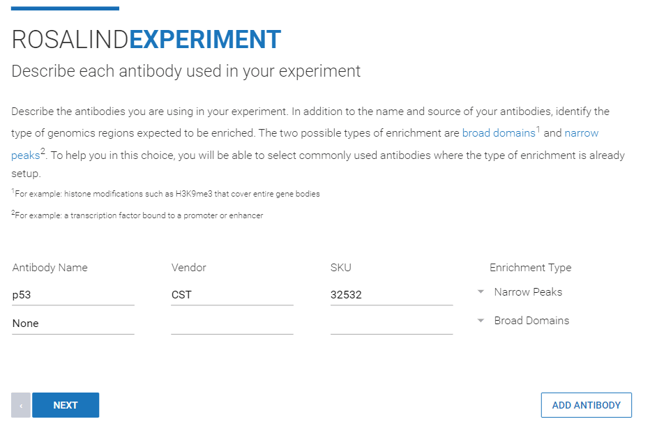
Step 9: Describe the antibodies used in the experiment by name, vendor, SKU, and enrichment type. When the antibody name is selected from the dropdown list, the “Enrichment Type” column will automatically populate with either “Broad Domains” or “Narrow Peaks” depending on the type of genomic region the selected antibody enriches.
Antibody name and enrichment type are required fields. Vendor and SKU information is optional.
Additional antibodies can be added by clicking ![]() .
.
Step 10: Specify sample attributes by typing the attribute categories into the "Enter Attributes" line.
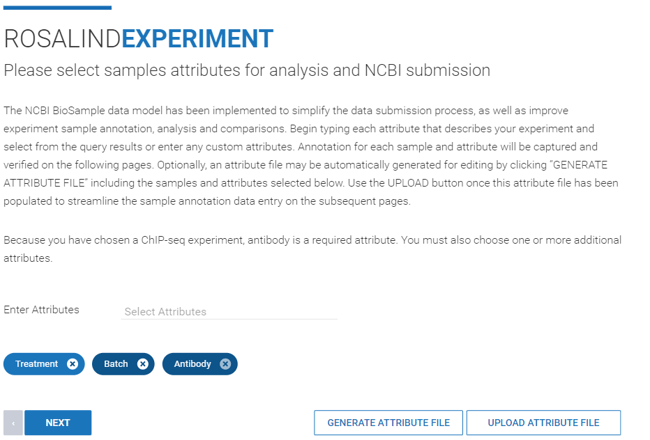
The attribute “Antibody” is a required attribute for ChIP-seq experiments.
After entering attribute categories, download an attribute file (.CSV format) by clicking ![]() . Within the file, attribute values can be manually assigned to each sample. The file can then be uploaded into ROSALIND by clicking
. Within the file, attribute values can be manually assigned to each sample. The file can then be uploaded into ROSALIND by clicking ![]() . Further instructions for attribute file creation can be found here.
. Further instructions for attribute file creation can be found here.
Click Next.
Step 11: ROSALIND displays a sample sheet to review for accuracy. Optionally, values for "Laboratory Identifier" and/or "Tube/Plate Barcode" can be added for internal tracking. Once reviewed, click Next.
Step 12: Indicate which samples are part of the same replicate group. This is optional though recommended to visually enhance attribute tracking. Select the drop down menu adjacent to each sample to assign replicate group membership. As replicates are assigned, replicate groups will change to coordinating colors for visual tracking. Once all replicates are assigned, click Next.

Step 13: Then, if you indicated that there are input or IgG controls in your experiment, choose those controls by clicking the checkbox next to the corresponding sample, click Next.
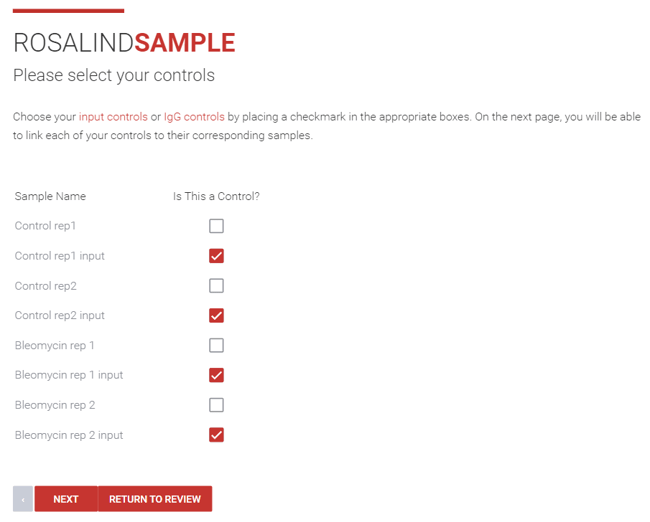
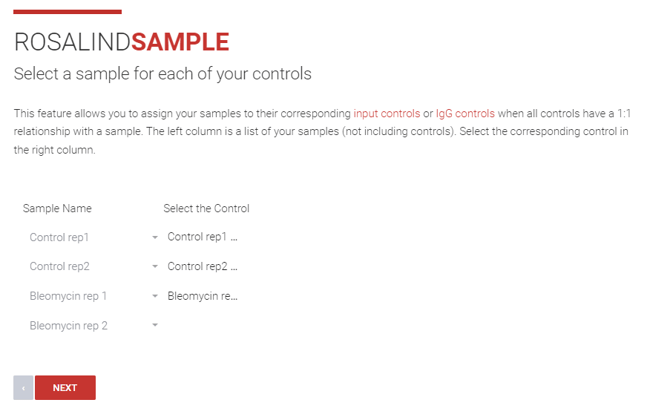
Step 14(a): If the controls have a 1:1 relationship with your samples, select the sample for each corresponding control using the dropdown menu in the “Select the Control” column, click Next.
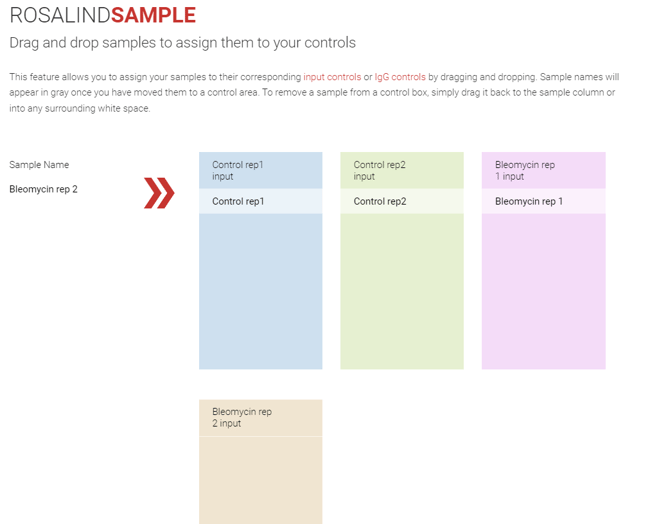
Step 14(b): If the controls do not have a 1:1 relationship with the samples, then samples can be assigned to the controls. Drag and drop the sample names into the box for their corresponding control, click Next.
Step 15: Replicate group membership can also be used for attribute changes and tracking. If an error is noted and an edit is made, this edit will be applied to all samples in the same replicate group, reducing time for edits and risk of error.
Click "Next" to review attribute information for each sample, one-by-one, or click the last red dot on the right side to skip to the last sample. Click Next to proceed to Final Sample Review.

Step 16: Final sample and control review can be displayed in a standard table or in a table with replicate group coloring applied. Use the "Colored By" drop down menu and select "Replicates" to turn on group coloring, if desired.

After reviewing the sample information, click ![]() to confirm that the information is correct.
to confirm that the information is correct.
Step 17: Comparisons can be configured now, prior to launching the analysis, or after the experiment has been processed and QC has been reviewed. To create a new comparison now, click ![]() . Comparisons can be created at the replicate group level (using the attributes) or individual sample level (using the sample names) by dragging and dropping different attributes or samples into the condition and control boxes on the right side of the page. Combinations of two or more different attributes can be used to create comparisons with specific subsets of samples.
. Comparisons can be created at the replicate group level (using the attributes) or individual sample level (using the sample names) by dragging and dropping different attributes or samples into the condition and control boxes on the right side of the page. Combinations of two or more different attributes can be used to create comparisons with specific subsets of samples.
Comparison creation can be toggled between Peaks Overlap or Differential Accessibility.

Peaks Overlap:
If you’re setting up a peaks overlap comparison, up to four comparison groups can be added by clicking ![]() underneath the Control group. A group can be deleted by clicking the minus icon that appears to the right of the group on hover. You can also edit the name of any group by clicking on it.
underneath the Control group. A group can be deleted by clicking the minus icon that appears to the right of the group on hover. You can also edit the name of any group by clicking on it.
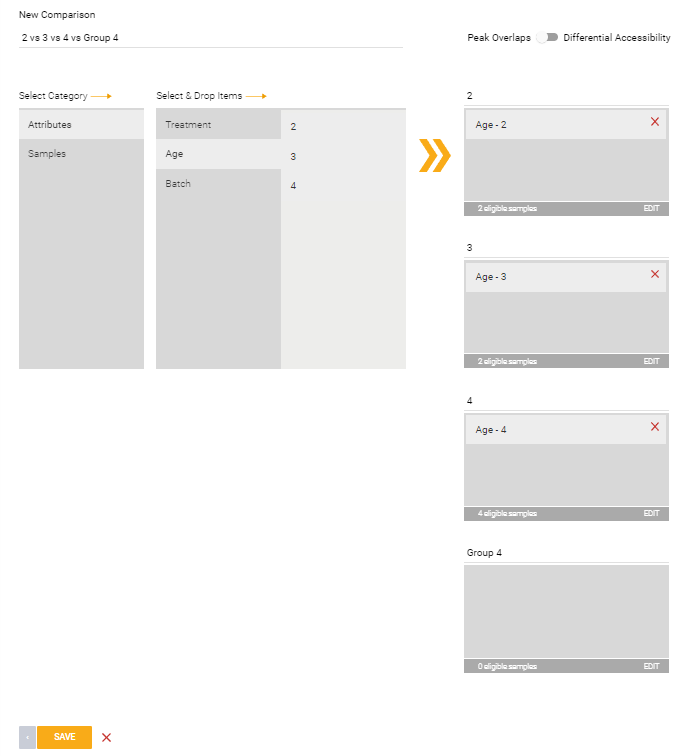
Differential Accessibility:
This option will compare the differential accessibility between two conditions. This can also be used within Meta-Analysis.
In the example image below, a comparison is set up across two treatment groups (Bleomycin vs DMSO) within a specific batch (batch 2).

Click the ![]() button to save the created comparison. Once all comparisons have been saved, click Next.
button to save the created comparison. Once all comparisons have been saved, click Next.
Step 18: Lastly, upload the FASTQ files (in FASTQ, GZ, or GZIP format). Toggle between "Single-End" (one file per sample) or "Paired-End" reads (left and right read per sample) according to the sequencing strategy of your experiment. Then click the file upload box adjacent to each sample name to navigate to and select the corresponding files. Alternatively, drag and drop the files into the corresponding boxes to initiate file upload. Do not close or navigate away from the page until upload of all files is complete. After successful upload of all files, the experiment will launch. ROSALIND will notify you via email once the processing is complete and your experiment is ready for exploration.

Step 1: Create a new Project folder by clicking ![]() . Enter a Title and Description (both can be edited at a later time).
. Enter a Title and Description (both can be edited at a later time).

Click the ![]() button to proceed and automatically create a new Experiment.
button to proceed and automatically create a new Experiment.
Alternatively, click on an existing Project folder to open it. Then create a new Experiment by clicking ![]() . Click the
. Click the ![]() button to proceed.
button to proceed.
Step 2: Select "Design a New Experiment" to access all available assay workflows, then click Next.

Step 3: Enter an "Experiment Title" and "Description" (both can be edited at a later time), then click Next.
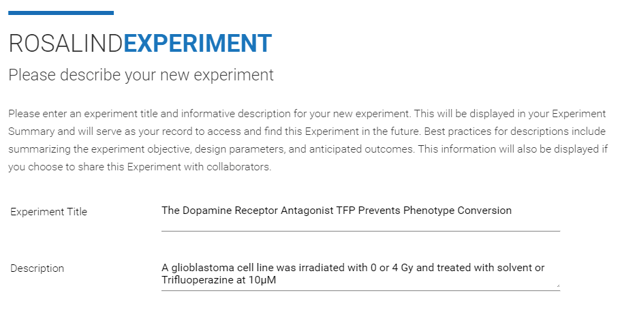
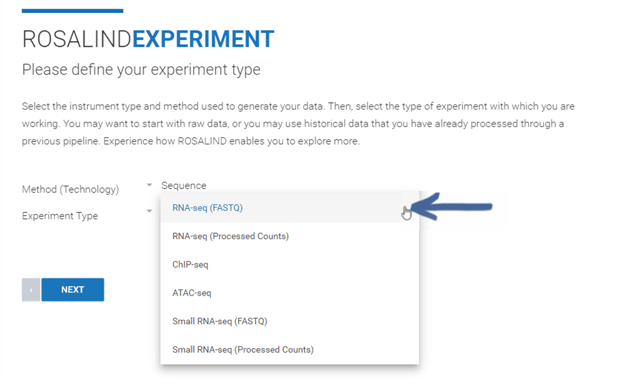
Step 4a (FASTQ only): If creating an Experiment from FASTQ files, use the "Method (Technology)" drop down menu to select "Sequence." From the "Experiment Type" drop down menu, select "RNA-seq (FASTQ)." Then click Next and skip to Step 5.
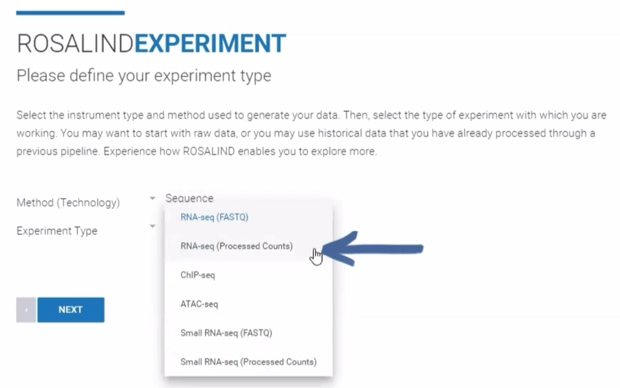
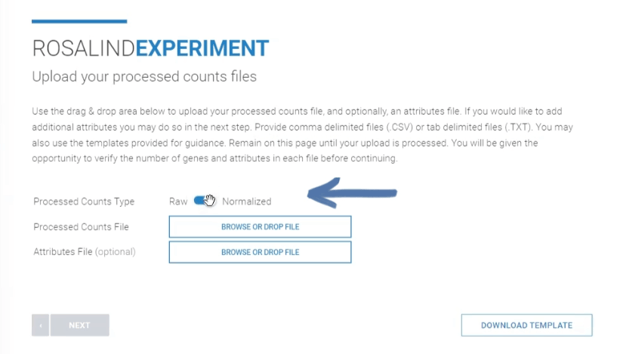
Step 4b (Processed Counts only): If creating an Experiment from a processed counts file (raw or normalized), use the "Method (Technology)" drop down menu to select "Sequence." From the "Experiment Type" drop down menu, select "RNA-seq (Processed Counts)." Then click Next.
Use the toggle to indicate if the processed counts are raw or normalized. Then click the Processed Counts File upload box ("BROWSE OR DROP FILE") to navigate to and select the input file, or drag and drop the file into the box to begin upload. Optionally, a completed Attribute File can be uploaded at this stage. If skipped, upload and creation of an Attribute File will occur later in the workflow. Click Next.
Step 5: Select the Species and Genome Build from the dropdown menus. ROSALIND offers genome builds from NCBI and Ensembl. Unless comparing the experiment to historic data, it is recommended to select the most recent build from your preferred source (NCBI or Ensembl). Click Next. If following the Processed Counts workflow, skip to Step 8.

Step 6 (FASTQ only): Select the "Kit Vendor" and "Kit Model" from the dropdown menus. If you are unsure which kit was used for the experiment, contact your service provider to obtain that information. If the name of the kit is not listed, reach out to ROSALIND Support at support@rosalind.bio for guidance, or select "Other" to run a generic, unstranded analysis.
Click ![]() to confirm the selection, and ensure both a "Sample Kit" and "Library Kit" are registered to continue. An "Auxiliary Kit" is optional.
to confirm the selection, and ensure both a "Sample Kit" and "Library Kit" are registered to continue. An "Auxiliary Kit" is optional.

Click Next.
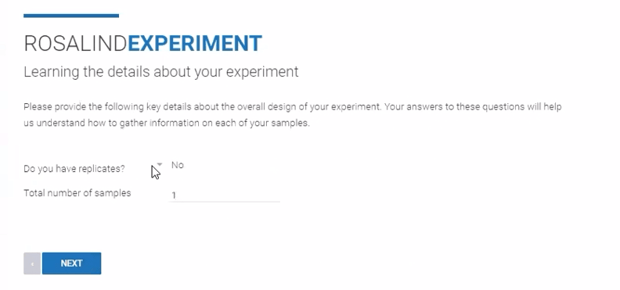
Step 7 (FASTQ only): From the drop down menu, indicate if the Experiment contains samples that are biological replicates ("Yes" or "No"). Enter the "Total number of samples" in the Experiment. Click Next.
Step 8: Specify sample attributes by typing the attribute categories into the "Enter Attributes" line.

After entering attribute categories, download an attribute file (.CSV format) by clicking ![]() . Within the file, attribute values can be manually assigned to each sample. The file can then be uploaded into ROSALIND by clicking
. Within the file, attribute values can be manually assigned to each sample. The file can then be uploaded into ROSALIND by clicking ![]() . Further instructions for attribute file creation can be found here.
. Further instructions for attribute file creation can be found here.
Click Next.
Step 9: ROSALIND displays a sample sheet to review for accuracy. Optionally, values for "Laboratory Identifier" and/or "Tube/Plate Barcode" can be added for internal tracking. Once reviewed, click Next.
Step 10 (FASTQ only): Indicate which samples are part of the same replicate group. This is optional though recommended to visually enhance attribute tracking. Select the drop down menu adjacent to each sample to assign replicate group membership. As replicates are assigned, replicate groups will change to coordinating colors for visual tracking. Once all replicates are assigned, click Next.

Step 11: Replicate group membership can also be used for attribute changes and tracking. If an error is noted and an edit is made, this edit will be applied to all samples in the same replicate group, reducing time for edits and risk of error.
Click "Next" to review attribute information for each sample, one-by-one, or click the last red dot on the right side to skip to the last sample. Click Next to proceed to Final Sample Review.
Step 12: Final sample review can be displayed in a standard table or in a table with replicate group coloring applied. Use the "Colored By" drop down menu and select "Replicates" to turn on group coloring, if desired.

After reviewing the sample information, click ![]() to confirm that the information is correct.
to confirm that the information is correct.
Step 13: Comparisons can be configured now, prior to launching the analysis, or after the experiment has been processed and QC has been reviewed. To create a new comparison now, click ![]() . Comparisons can be created at the replicate group level (using the attributes) or individual sample level (using the sample names) by dragging and dropping different attributes or samples into the condition and control boxes on the right side of the page. Combinations of two or more different attributes can be used to create comparisons with specific subsets of samples. In the example image below, a comparison is set up across two treatment groups (Radiation vs Control) at a specific time point (1 hour). Alternatively, the comparison could be set up specifically at only the 48 hour time point, or including both time points simultaneously.
. Comparisons can be created at the replicate group level (using the attributes) or individual sample level (using the sample names) by dragging and dropping different attributes or samples into the condition and control boxes on the right side of the page. Combinations of two or more different attributes can be used to create comparisons with specific subsets of samples. In the example image below, a comparison is set up across two treatment groups (Radiation vs Control) at a specific time point (1 hour). Alternatively, the comparison could be set up specifically at only the 48 hour time point, or including both time points simultaneously.
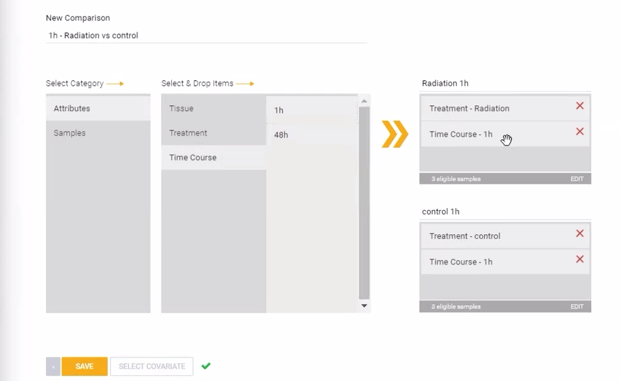
Additionally, covariate correction can be added to the statistical model using the "SELECT COVARIATE" button. Click here to learn more about covariate correction for RNA-seq analysis.
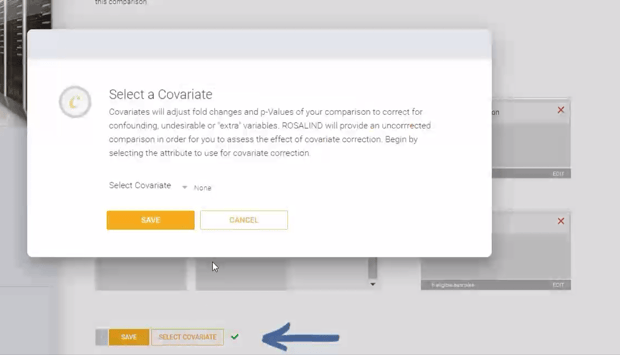
Click the ![]() button to save the created comparison. Once all comparisons have been saved, click Next.
button to save the created comparison. Once all comparisons have been saved, click Next.
*Note: If the experiment was created using Processed Counts, then experiment will launch after comparison creation is complete.
Step 14 (FASTQ only): Lastly, upload the FASTQ files (in FASTQ, GZ, or GZIP format). Toggle between "Single-End" (one file per sample) or "Paired-End" reads (left and right read per sample) according to the sequencing strategy of your experiment. Then click the file upload box adjacent to each sample name to navigate to and select the corresponding files. Alternatively, drag and drop the files into the corresponding boxes to initiate file upload. Do not close or navigate away from the page until upload of all files is complete. After successful upload of all files, the experiment will launch. ROSALIND will notify you via email once the processing is complete and your experiment is ready for exploration.

*See Step10 for Advanced nCounter Features
Step 1: Create a new Project folder by clicking ![]() . Enter a Title and Description (both can be edited at a later time).
. Enter a Title and Description (both can be edited at a later time).

Click the ![]() button to proceed and automatically create a new Experiment.
button to proceed and automatically create a new Experiment.
Alternatively, click on an existing Project folder to open it. Then create a new Experiment by clicking ![]() . Click the
. Click the ![]() button to proceed.
button to proceed.
Step 2: Select "Partner Recommended Analysis" to access NanoString assay workflows, then click Next.
Step 3: Select "NanoString nCounter Data Analysis"

Then click Next.
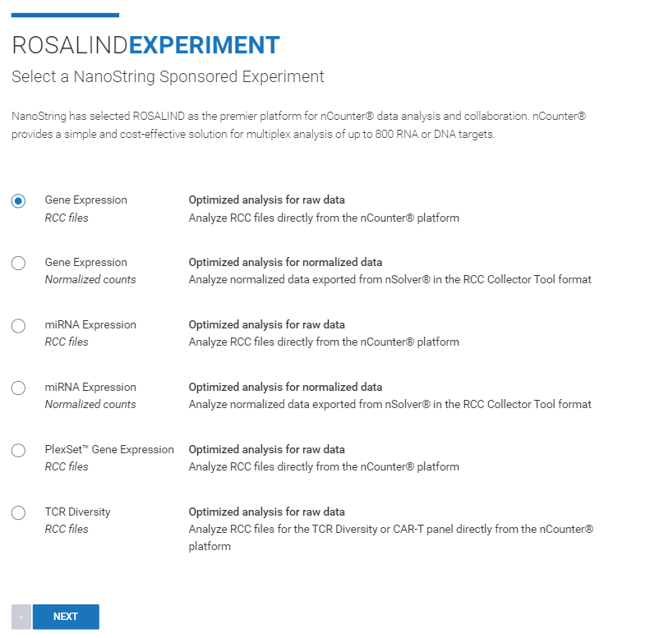
Step 4: Select which datasets you are looking to upload. ROSALIND is compatible with raw data as RCCs or normalized counts exported from nSolver.
Step 5: Enter an "Experiment Title" and "Description" (both can be edited at a later time), then click Next.
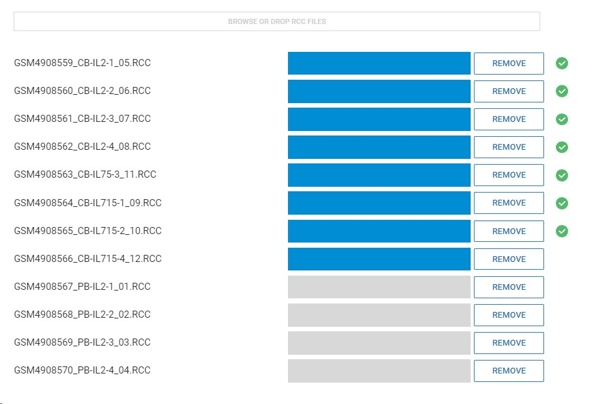
Step 6: Drag and drop your RCC files to upload them to ROSALIND.
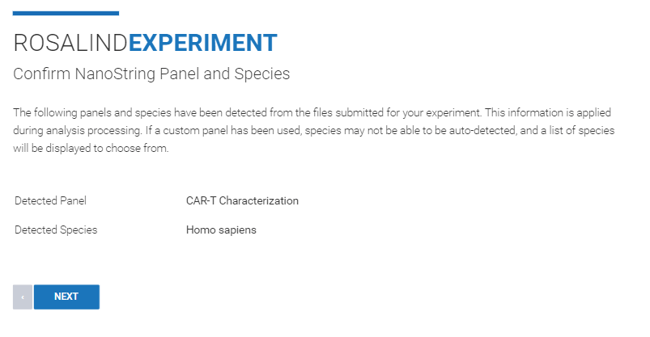
Step 7: ROSALIND intelligently auto-detects the species and panel of your RCC files, but if your samples are of a different species or a different panel you can select the correct species and panel from the dropdown menu.
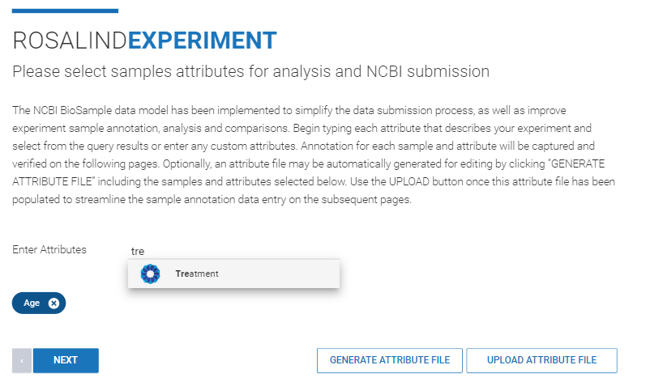
Step 8: Specify attributes for each of your samples or upload an attribute file. You can find further instructions on how to create an attribute file here.
Step 9: ROSALIND provides a sample sheet to review for accuracy of sample information, changes can be made directly on the sample sheet if needed.
Once reviewed, click ![]() .
.
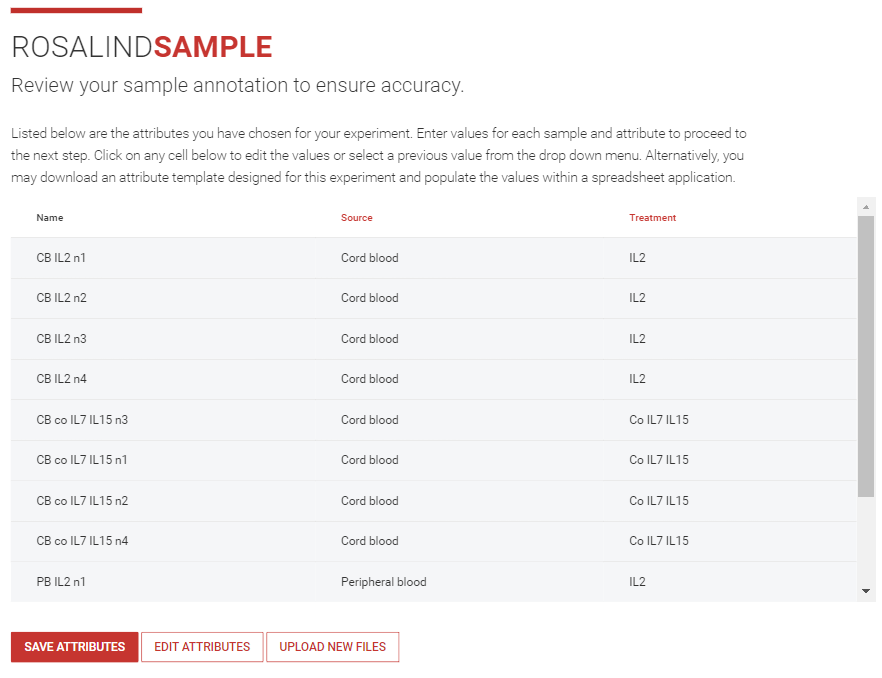
Step 10: ROSALIND will immediately begin initializing and processing the data in preparation for pruning and normalization (Note: this may take up to several minutes depending on the size of the data).
Once finalized, an option between Default and Advanced (available to paid subscribers) options will become available.
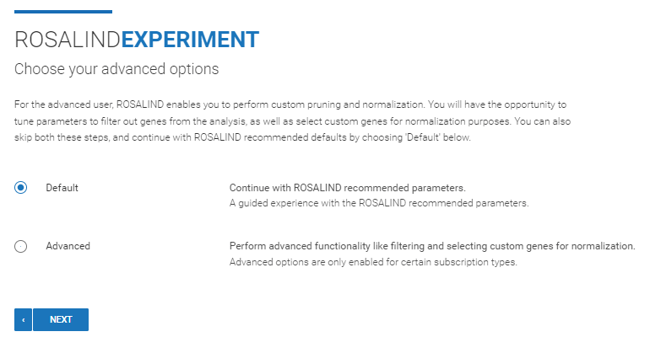
Default: This option is available to all users. Default parameters for probe pruning and housekeeper selection will be applied. To learn more, see the nCounter Methods section in Knowledge Hub.
If this option is selected, proceed to Step 13.
Advanced: *This option is available to ROSALIND Paid Subscribers. Select this option for custom probe pruning and selection of probes for normalization.
Step 11 (Advanced): Thresholds and probes for pruning can be customized. Default parameters include Low Count Threshold, or Limit of Detection, and Sample Frequency Default.
Low Count Threshold is a unique value to your dataset calculated from the negative probes independently across all samples to estimate the background noise of your data. If this threshold is adjusted, it will override sample-specific defaults and apply the new threshold across all samples.
Sample Frequency determines how many samples the raw expression must fall below threshold in order to be pruned. This default is set to 85%, so probes must fall below threshold in 85% of samples to be pruned. Decreasing sample frequency is more stringent, while increasing sample frequency is more permissive.
Probes that fail both thresholds will be highlighted red, set to be pruned (removed) from the dataset, and listed in the table to the right with ![]() red arrows. Columns can be sorted by selecting the header.
red arrows. Columns can be sorted by selecting the header.
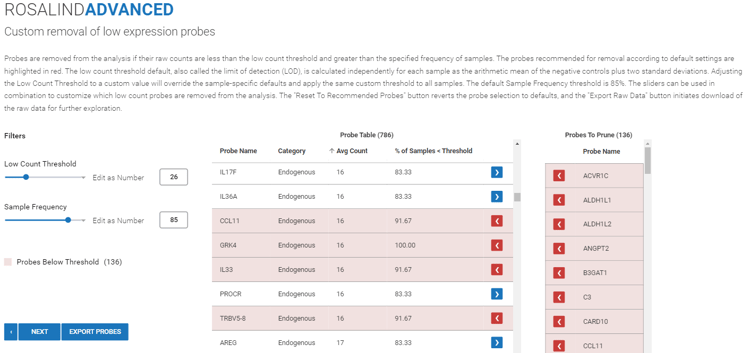
To maintain a probe in the dataset and prevent it from pruning, select the ![]() arrow next to the probe to change it to a
arrow next to the probe to change it to a ![]() blue arrow.
blue arrow.
To prune (remove) a probe from the dataset, select the ![]() blue arrow to change it to a
blue arrow to change it to a ![]() red arrow.
red arrow.
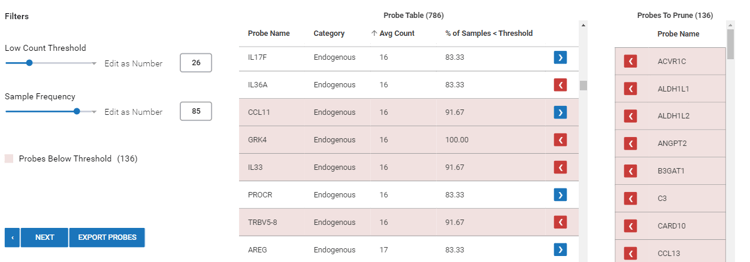
(Optional): Select ![]() to perform custom pruning outside of ROSALIND.
to perform custom pruning outside of ROSALIND.
Click, Next.
Step 12 (Advanced): Average probe expression and %CV thresholds to determine probes for normalization can be customized.
Default parameters will show an average expression of raw counts across all samples and %CV will be calculated as (standard deviation /arithmetic mean) x 100. Both thresholds can be edited by the respective sliders or by manually typing.
Housekeeping genes that pass both filters will be highlighted green, set to be included in normalization, and listed in the table to the right with ![]() red arrows. Columns can be sorted by selecting the header.
red arrows. Columns can be sorted by selecting the header.
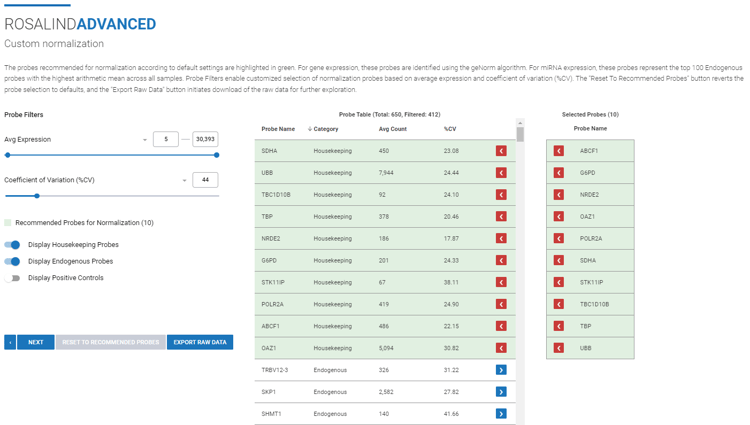
To deselect a probe used for normalization, select the ![]() arrow next to the probe to change it to a
arrow next to the probe to change it to a ![]() blue arrow.
blue arrow.
To select a probe to use for normalization, select the ![]() blue arrow to change it to a
blue arrow to change it to a ![]() red arrow.
red arrow.
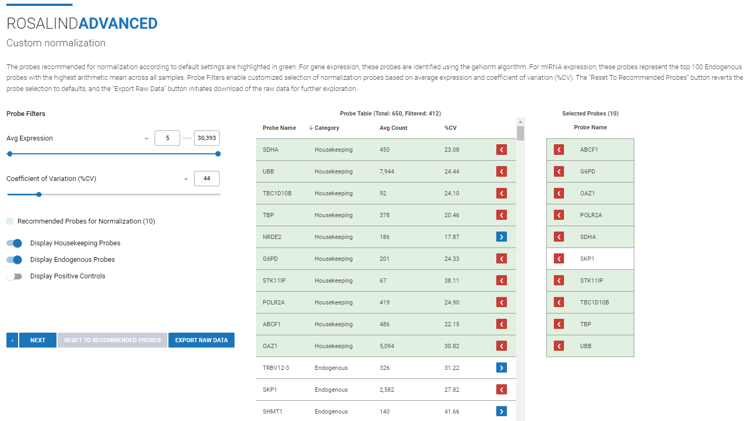
(Optional): Select ![]() to perform custom normalization outside of ROSALIND.
to perform custom normalization outside of ROSALIND.
Click, Next.
Step 13: Comparisons can be configured now, prior to launching the analysis, or after the experiment has been processed and QC has been reviewed. To create a new comparison now, click ![]() . Comparisons can be created at the replicate group level (using the attributes) or individual sample level (using the sample names) by dragging and dropping different attributes or samples into the condition and control boxes on the right side of the page. Combinations of two or more different attributes can be used to create comparisons with specific subsets of samples. In the example image below, a comparison is set up across two treatment groups (Radiation vs Control) at a specific time point (1 hour). Alternatively, the comparison could be set up specifically at only the 48 hour time point, or including both time points simultaneously.
. Comparisons can be created at the replicate group level (using the attributes) or individual sample level (using the sample names) by dragging and dropping different attributes or samples into the condition and control boxes on the right side of the page. Combinations of two or more different attributes can be used to create comparisons with specific subsets of samples. In the example image below, a comparison is set up across two treatment groups (Radiation vs Control) at a specific time point (1 hour). Alternatively, the comparison could be set up specifically at only the 48 hour time point, or including both time points simultaneously.
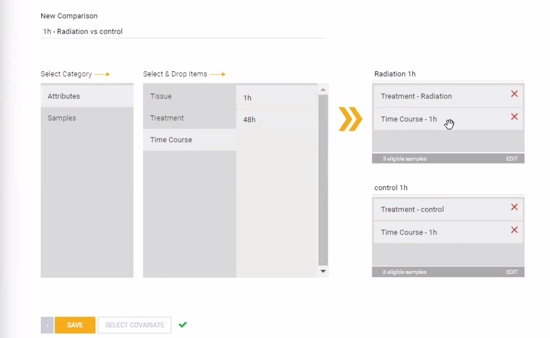
Additionally, covariate correction can be added to the statistical model using the "SELECT COVARIATE" button. See this article to learn more about covariate correction methods.
Click the ![]() button to save the created comparison.
button to save the created comparison.
Step 11: The experiment will automatically launch. ROSALIND will notify you via email once the processing is complete and your experiment is ready for exploration.
Download the TCR Walkthrough document
Step 1: Create a new Project folder by clicking ![]() . Enter a Title and Description (both can be edited at a later time).
. Enter a Title and Description (both can be edited at a later time).

Click the ![]() button to proceed and automatically create a new Experiment.
button to proceed and automatically create a new Experiment.
Alternatively, click on an existing Project folder to open it. Then create a new Experiment by clicking ![]() . Click the
. Click the ![]() button to proceed.
button to proceed.
Step 2: Select "Partner Recommended Analysis" to access NanoString assay workflows, then click Next.
Step 3: Select "NanoString nCounter Data Analysis"

Then click Next.
Step 4: Select "TCR Diversity"
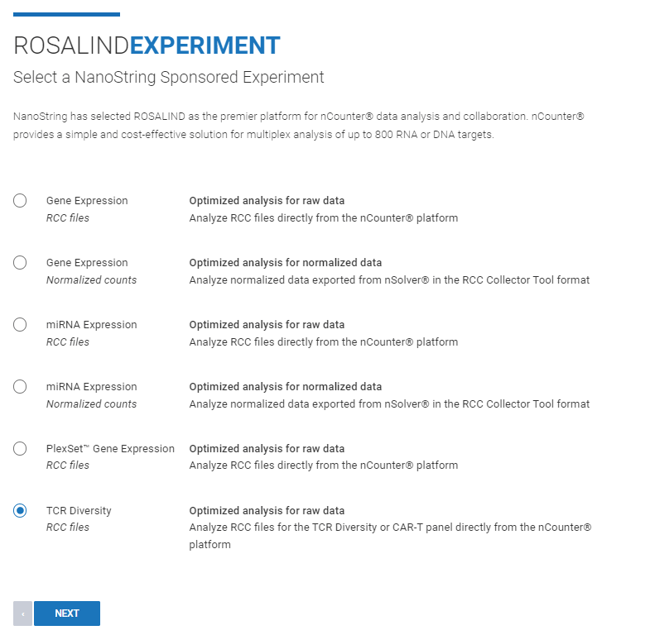
Step 5: Enter an "Experiment Title" and "Description" (both can be edited at a later time), then click Next.
Step 6: Drag and drop your RCC files to upload them to ROSALIND.
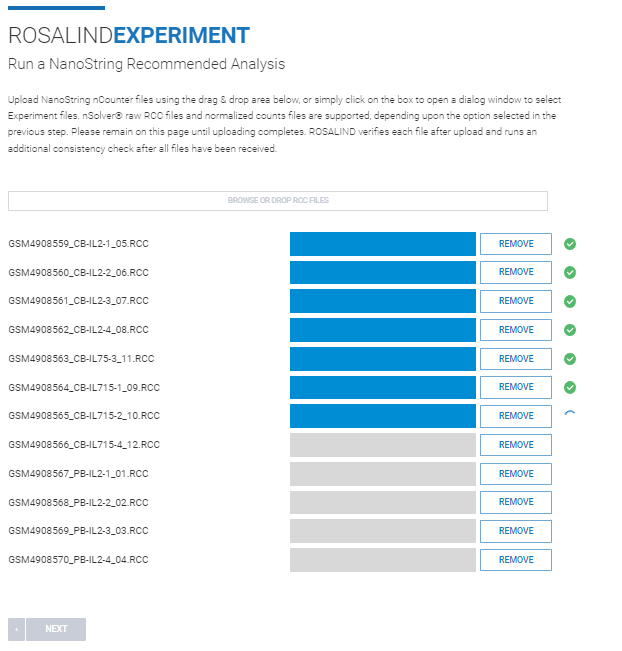
Step 7: ROSALIND runs validation to ensure the panel run was either TCR Diversity or CAR-T Characterization, and that all samples were run with the same panel.
If validation confirms all samples were run with a TCR Diversity or CAR-T panel, a warning will confirm proceeding with the TCR Diversity module.
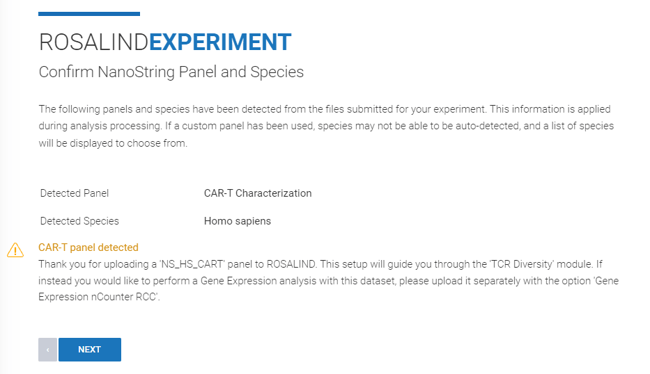
Step 8: Specify attributes for each of your samples or upload an attribute file. You can find further instructions on how to create an attribute file here.
For examples of TCR Attribute Templates, see the Attribute Template Formatting Guide.

Step 9: ROSALIND provides a sample sheet to review for accuracy of sample information, changes can be made directly on the sample sheet if needed.
Once reviewed, click ![]() .
.
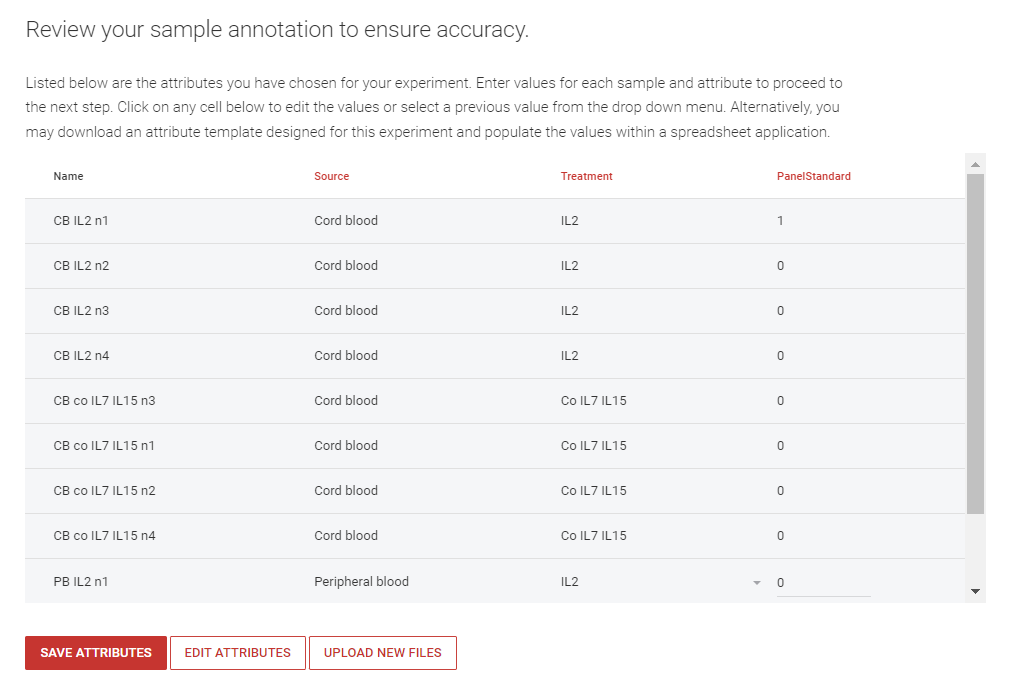
Step 10: After attribute review, an attribute checklist will confirm the TCR Reports that will be generated. Click ![]() .
.
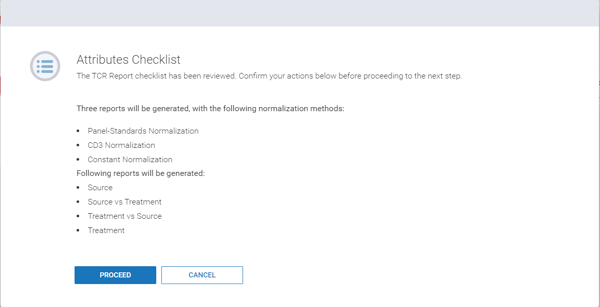
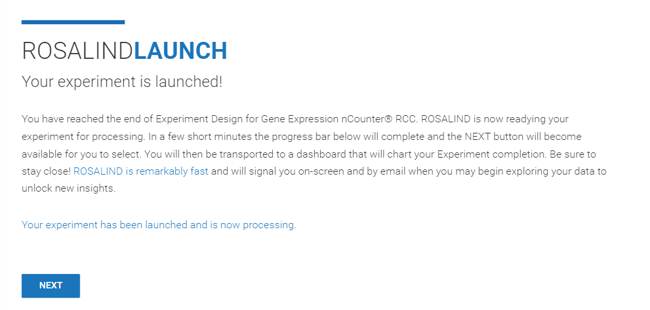
Step 11: The experiment will automatically launch. ROSALIND will notify you via email once the processing is complete and your experiment is ready for exploration.
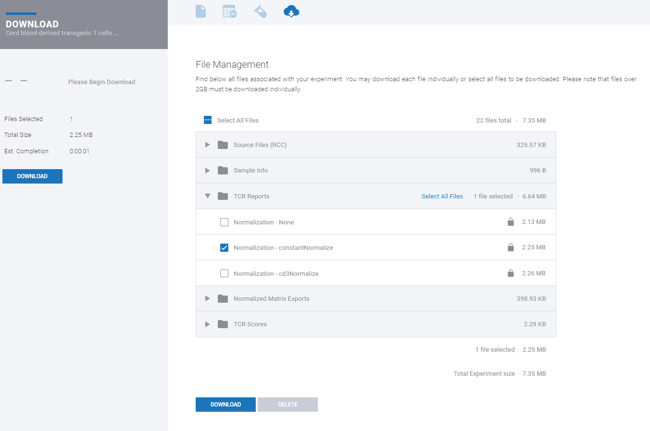
Step 12: Once the experiment is complete, report downloads will be present in the File Management tab ![]() .
.
Within File Management, access the “TCR Report” or "TCR Scores" folder. Three TCR reports will be available based on the 3 options for normalization. Within each report, images are available for individual download using a download icon at the side of each figure.
Step 1: Create a new Project folder by clicking ![]() . Enter a Title and Description (both can be edited at a later time).
. Enter a Title and Description (both can be edited at a later time).

Click the ![]() button to proceed and automatically create a new Experiment.
button to proceed and automatically create a new Experiment.
Alternatively, click on an existing Project folder to open it. Then create a new Experiment by clicking ![]() . Click the
. Click the ![]() button to proceed.
button to proceed.
Step 2: Select "Design a New Experiment" to access all available assay workflows, then click Next.

Step 3: Enter an "Experiment Title" and "Description" (both can be edited at a later time), then click Next.
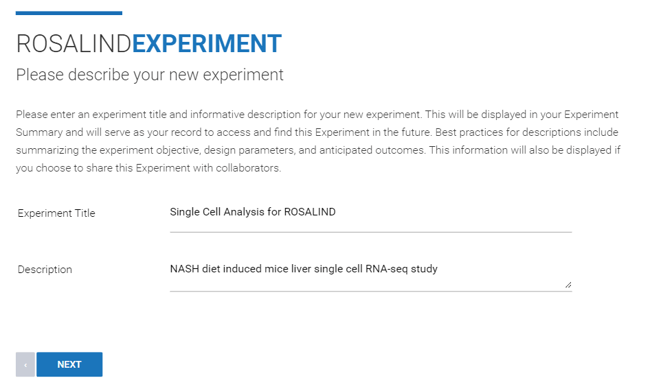
Step 4: Use the "Method (Technology)" drop down menu to select "Single Cell Transcriptomics".
Then, select your Single Cell Experiment type from:
a) Seurat RDS object "scRNA-seq (rds File)"
b) Aggregrate H5 file "scRNA-seq (cell_matrix.h5)" or
c) FASTQ files "scRNA-seq from FASTQ"

Then click Next.
Step 5 (RDS or H5 file only):
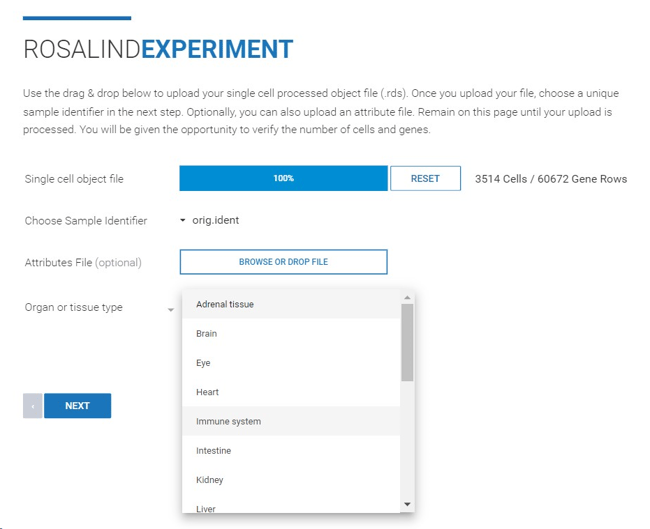
a) Click the Single cell object file upload box ("BROWSE OR DROP FILE") to navigate to and select the input file, or drag and drop the file into the box to begin upload.
b) Select your Sample Identifier: this is the column header for your samples column from your RDS file
c) Optionally, a completed Attribute File can be uploaded at this stage. If skipped, upload and creation of an Attribute File will occur later in the workflow.
d) Select your "Organ or tissue type" for ROSALIND Cell Type Prediction.
Note: Selecting "Other" will opt out of running ROSALIND Cell Type Prediction
Click Next.
Step 6: Select the Species and Genome Build from the dropdown menus. ROSALIND offers genome builds from NCBI and Ensembl. Unless comparing the experiment to historic data, it is recommended to select the most recent build from your preferred source (NCBI or Ensembl).
Click Next.

Step 7 (FASTQ only): Select the "Kit Vendor" and "Kit Model" from the dropdown menus. If you are unsure which kit was used for the experiment, contact your service provider to obtain that information. If the name of the kit is not listed, reach out to ROSALIND Support at support@rosalind.bio for guidance, or select "Other" to run a generic, unstranded analysis.
Click ![]() to confirm the selection, and ensure both a "Sample Kit" and "Library Kit" are registered to continue. An "Auxiliary Kit" is optional.
to confirm the selection, and ensure both a "Sample Kit" and "Library Kit" are registered to continue. An "Auxiliary Kit" is optional.

Click Next.
Step 8 (FASTQ Only):
a) From the drop down menu, indicate if the Experiment contains samples that are biological replicates ("Yes" or "No")
b) Enter the "Total number of samples" in the Experiment
c) Select your "Organ or tissue type" for ROSALIND Cell Type Prediction
Note: Selecting "Other" will opt out of running ROSLAIND Cell Type Prediction
d) Specify if your sample preparation is "Single Cell" or "Single Nuclei"
Then, click Next.

Step 9: Specify sample attributes by typing the attribute categories into the "Enter Attributes" line.

After entering attribute categories, download an attribute file (.CSV format) by clicking ![]() . Within the file, attribute values can be manually assigned to each sample. The file can then be uploaded into ROSALIND by clicking
. Within the file, attribute values can be manually assigned to each sample. The file can then be uploaded into ROSALIND by clicking ![]() . Further instructions for attribute file creation can be found here.
. Further instructions for attribute file creation can be found here.
Click Next.
Step 10: ROSALIND displays a sample sheet to review for accuracy. Optionally, values for "Laboratory Identifier" and/or "Tube/Plate Barcode" can be added for internal tracking.
Once reviewed, click ![]()
Step 11 (FASTQ only): Indicate which samples are part of the same replicate group. This is optional though recommended to visually enhance attribute tracking. Select the drop down menu adjacent to each sample to assign replicate group membership. As replicates are assigned, replicate groups will change to coordinating colors for visual tracking.
Once all replicates are assigned, click Next.

Step 12: Replicate group membership can also be used for attribute changes and tracking. If an error is noted and an edit is made, this edit will be applied to all samples in the same replicate group, reducing time for edits and risk of error.
Click "Next" to review attribute information for each sample, one-by-one, or click the last red dot on the right side to skip to the last sample. Click Next to proceed to Final Sample Review.
Step 13: Final sample review can be displayed in a standard table or in a table with replicate group coloring applied. Use the "Colored By" drop down menu and select "Replicates" to turn on group coloring, if desired.

After reviewing the sample information, click ![]() to confirm that the information is correct.
to confirm that the information is correct.
Step 14: Comparisons can be configured now, prior to launching the analysis, or after the experiment has been processed and QC has been reviewed. Comparisons created now will be at the sample level. Single cell level comparisons can be created after experiment launch and processing. Comparison creation is identical between levels.
To create a new comparison now, click ![]() . Comparisons can be created at the replicate group level (using the attributes) or individual sample level (using the sample names) by dragging and dropping different attributes or samples into the condition and control boxes on the right side of the page. Combinations of two or more different attributes can be used to create comparisons with specific subsets of samples. In the example image below, a comparison is set up across two treatment groups (Radiation vs Control) at a specific time point (1 hour). Alternatively, the comparison could be set up specifically at only the 48 hour time point, or including both time points simultaneously.
. Comparisons can be created at the replicate group level (using the attributes) or individual sample level (using the sample names) by dragging and dropping different attributes or samples into the condition and control boxes on the right side of the page. Combinations of two or more different attributes can be used to create comparisons with specific subsets of samples. In the example image below, a comparison is set up across two treatment groups (Radiation vs Control) at a specific time point (1 hour). Alternatively, the comparison could be set up specifically at only the 48 hour time point, or including both time points simultaneously.

Additionally, covariate correction can be added to the statistical model using the "SELECT COVARIATE" button. Click here to learn more about covariate correction.

Click the ![]() button to save the created comparison. Once all comparisons have been saved, click Next.
button to save the created comparison. Once all comparisons have been saved, click Next.
*Note: If the experiment was created using an RDS or Aggregate H5 File, then experiment will launch after comparison creation is complete.
Step 15 (FASTQ only): Lastly, upload the FASTQ files (in FASTQ, GZ, or GZIP format). Toggle between "Single-End" (one file per sample) or "Paired-End" reads (left and right read per sample) according to the sequencing strategy of your experiment. Then click the file upload box adjacent to each sample name to navigate to and select the corresponding files. Alternatively, drag and drop the files into the corresponding boxes to initiate file upload. Do not close or navigate away from the page until upload of all files is complete. After successful upload of all files, the experiment will launch. ROSALIND will notify you via email once the processing is complete and your experiment is ready for exploration.

*Note: Public Data Import currently supports RNA-seq, small RNA-seq, and ATAC-seq experiments
Step 1: Create a new Project folder by clicking ![]() . Enter a Title and Description (both can be edited at a later time).
. Enter a Title and Description (both can be edited at a later time).

Click the ![]() button to proceed and automatically create a new Experiment.
button to proceed and automatically create a new Experiment.
Alternatively, click on an existing Project folder to open it. Then create a new Experiment by clicking ![]() . Click the
. Click the ![]() button to proceed.
button to proceed.
Step 2: Select "Import a Public Experiment", then click Next.

Step 3: Locate the public dataset BioProject Accession Number within the experiment details from the NCBI BioProject database.
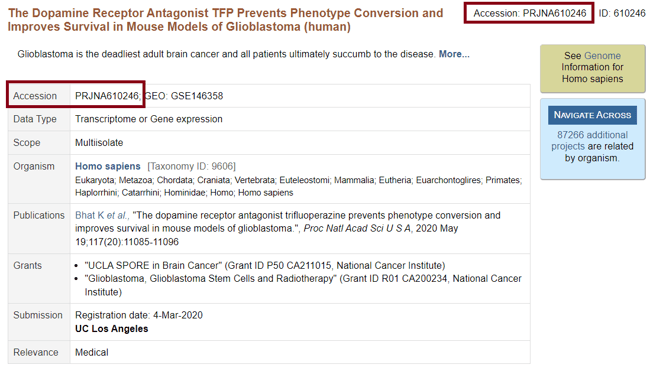
Step 4: Enter the Accession Number and click ![]() .
.
ROSALIND will then display metadata pulled from the experiment. This includes a name, description, experiment type, organism, and the number of samples. Then, click ![]() .
.
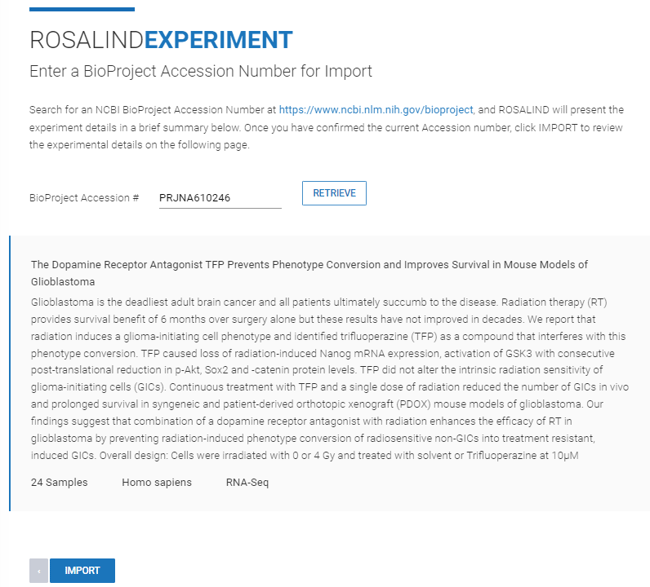
If an invalid Accession Number is entered, no metadata will be displayed and a “No Data Submitted” error message will appear. This error message will also appear if the corresponding public experiment does not have submitted data or if the submitted data is incomplete.

If an Accession Number containing an unsupported experiment type (i.e., experiments that are not RNA-seq, ATAC-seq, or small RNA-seq) is retrieved, an “Unsupported Experiment Type” error message will appear. If the experiment contains multi-isolate data (samples from multiple assay types), proceed forward and remove samples from unsupported experiment types to ensure a successful launch.

Step 5: After the metadata have been imported, review each section of the experiment details.
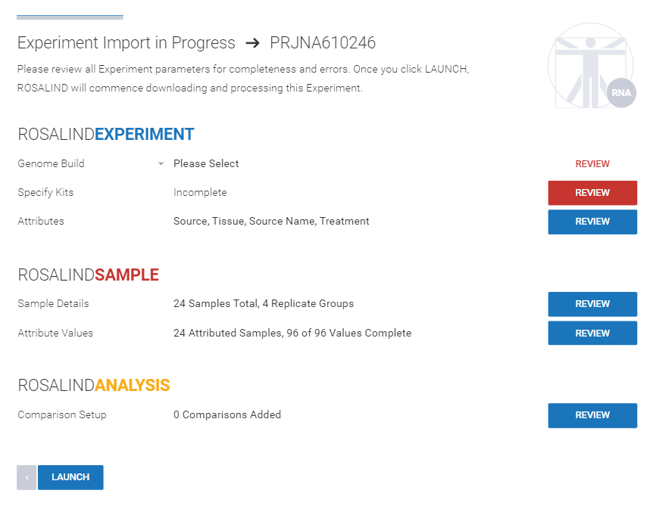
Step 6: Select the genome build from the dropdown menu.

Step 7: Select ![]() to specify the library kit used. Use the construction protocol linked on the page to find the experiment sample construction protocol from NCBI.
to specify the library kit used. Use the construction protocol linked on the page to find the experiment sample construction protocol from NCBI.
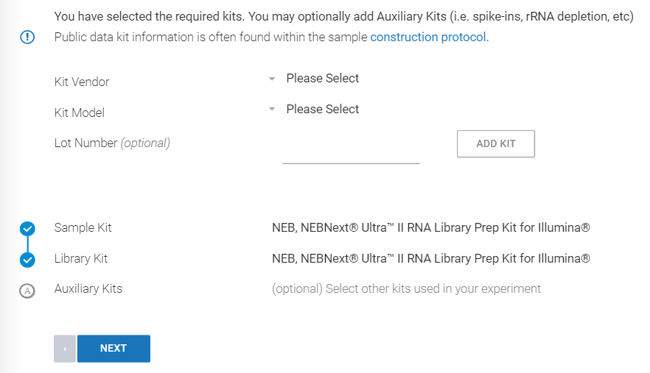
Click, Next.
Step 8: Optionally review your sample attributes. Attributes are automatically pulled from the imported data and are listed on the import details page. Clicking ![]() allows you to edit attributes. Alternatively, the name of a custom attribute name can be entered.
allows you to edit attributes. Alternatively, the name of a custom attribute name can be entered.
You also have the option to generate an attribute file, download it, edit it, and re-upload it. More information about generating an attribute file can be found here.
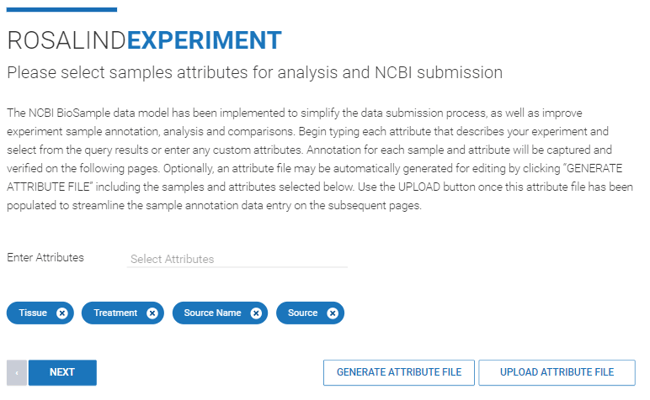
Click, Next.
Once a section has been reviewed and completed, that section will update from ![]() to a
to a ![]() status. Completed statuses can still be selected for further review.
status. Completed statuses can still be selected for further review.
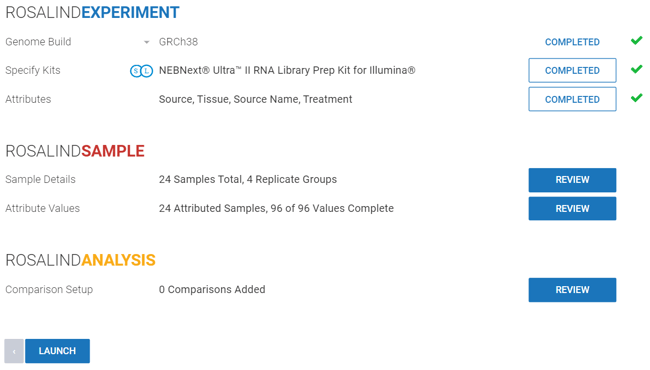
Step 9: Optionally review your sample details. In the Sample Details page, you’ll see a table with sample names, laboratory identifiers, and tube/plate barcode numbers that have been pulled from the imported data. You can edit any of the fields and optionally delete samples.
Clicking the back button will save any edits you’ve made and return you to the import details page.
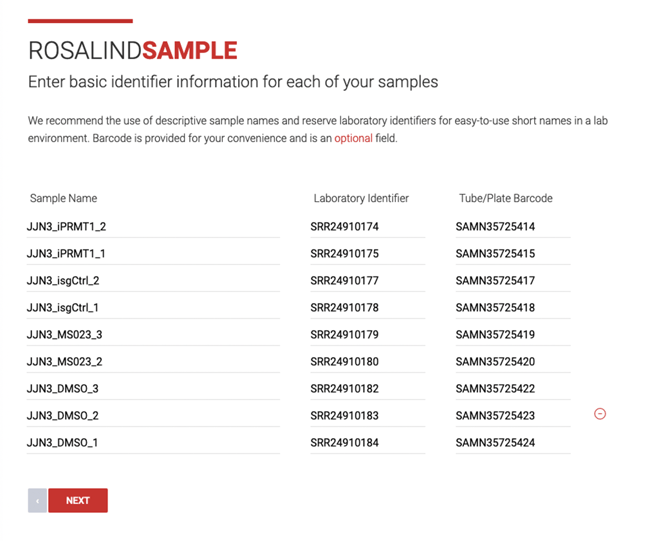
Click, Next.
Step 10: If the imported data included information about replicates, then the samples will be grouped accordingly. However, the dropdown menus can be used to edit the replicate groups. Samples are color coded by replicate group.
Click the back button to go back to the sample details page or ![]() to return to the import details page.
to return to the import details page.
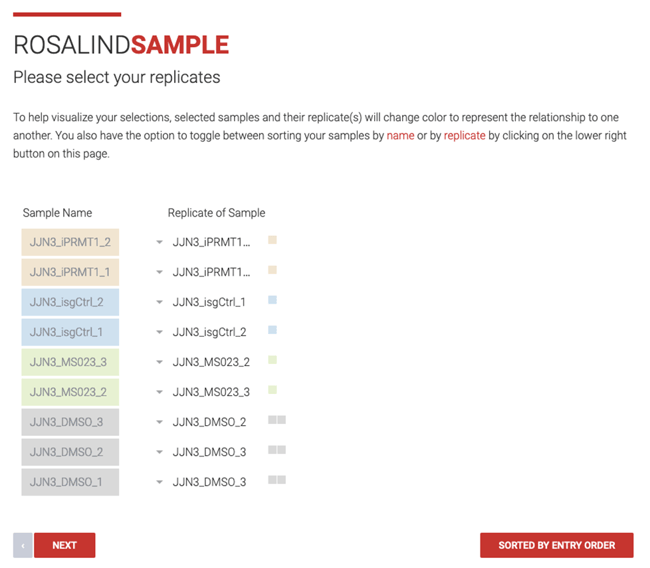
Step 11: The attributes and values are automatically populated based on the information in the imported metadata or the attributes file uploaded.
Review attribute information for each sample, one-by-one, or click the last red dot on the right side to skip to the last sample. Click Next to return to the import details page.

Step 12: Comparisons can be configured now, prior to launching the analysis, or after the experiment has been processed and QC has been reviewed. To create a new comparison now, click ![]() .
.
For details on creating comparisons for RNA-seq experiments: See Step 13 in Bulk RNA-seq Experiment Set Up Walkthrough, or visit the Video Library.
For details on creating comparisons for ATAC-seq experiments: See Step 13 in ATAC-seq Experiment Set Up Walkthrough.
Click the ![]() button to save the created comparison. Once all comparisons have been saved, click Next.
button to save the created comparison. Once all comparisons have been saved, click Next.
Step 13: When all experiment details have been reviewed and completed, select ![]()
If the experiment is launched without all required items, a checklist will appear with missing details. Complete the details to proceed with launch.
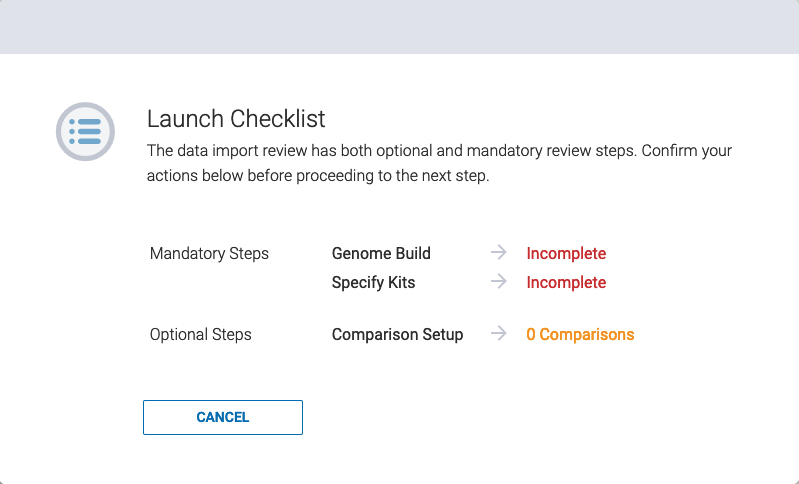
If the experiment is launched without created comparisons, a warning will appear for confirmation to proceed. Click ![]() to launch the experiment.
to launch the experiment.
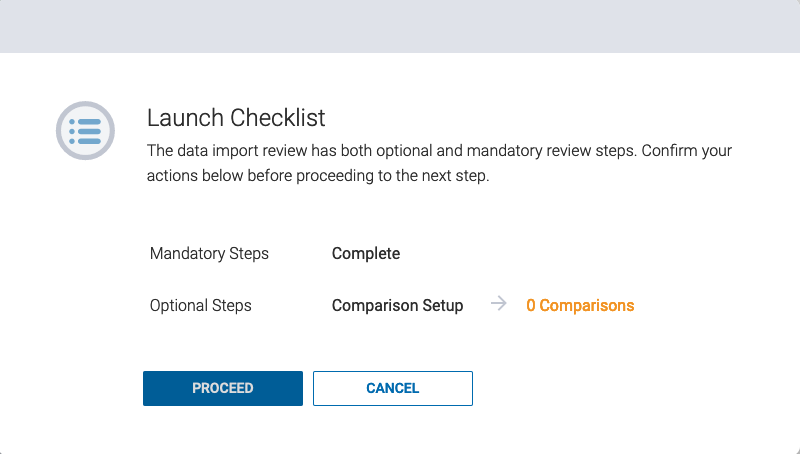
After the experiment is launched, you’ll be taken to the experiment summary containing information about the experiment and ROSALIND’s analysis methods.
When processing is complete, ROSALIND will send you an email notification.
Access our Full Video Library for quick How-To and Full-length Training videos
Watch our Meta-Analysis tutorial series to learn how to create, access, and interpret your meta-analyses for novel research discoveries.
Learn how to create a space for collaboration on your projects across the globe.
Learn how to perform covariate correction and how covariate correction can enhance your data analysis.