NanoString GeoMx Spatial Transcriptomics
The recommended and preferred solution for best-in-class GeoMx data analysis
NanoString nCounter Gene and miRNA Expression
Bruker's recommended and preferred solution for best-in-class nCounter data analysis
Bulk RNA-seq Gene Expression
DIY Bioinformatics for this genomics staple
CS Genetics SimpleCell 3' Gene Expression
Single Cell Without the Hassle (or Instrument)
Single Cell Gene Expression
From FASTQ to cell clusters and beyond
Gene Regulation & Anti-Sense: Small RNA-seq
Small RNA-seq data analysis designed for the biologist
Histone Mark & Transcription Factor: ChIP-seq
Comprehensive ChIP-seq data analysis
Chromatin Accessibility: ATAC-Seq
Genome-wide chromatin accessibility analysis
Sharing & Collaboration
Accelerate teamwork anywhere in the world
Knowledge Graph and Search
Data organized for semantic queries
COVID-19 Diagnostic Monitoring System
SARS-CoV-2 Viral Mutation Tracking
COVID Research Community
Global research analyzing COVID-19 genomic datasets
Immuno Oncology
Making discoveries on IO research
Breast Cancer
Identifying differentially expressed miRNAs in breast cancer
HIV
Transcriptional and genomic profiling study of HIV+ DLBCL
Diabetes
Discover and accelerate T1D
Multi-Omics Dataset
Explore multi-omics datasets in epigenetics research
Single Cell Data
Explore datasets with our Cell Ranger graph-based clustering
nanoString Gene Expression
Analyze your nCounter data in minutes
nanoString Mouse Glial Profiling Panel
Explore neuroinflammatory astrocyte subtypes in the mouse brain
RNA-Seq Data
Get started with bulk RNA-Seq data
Subscriptions and Pricing
Learn about Enterprise, Professional, and Academic subscriptions
Enterprise Offering
Expand the depth and reach of your scientific data teams
ROSALIND transforms the analysis of RNA-seq data with an end-to-end web-based experience for analysis, interpretation and collaboration. Scientists of every skill level benefit from ROSALIND since no programming or bioinformatics are required. Receive same-day results with every experiment in an interactive experience designed for ease of use and saving valuable time.
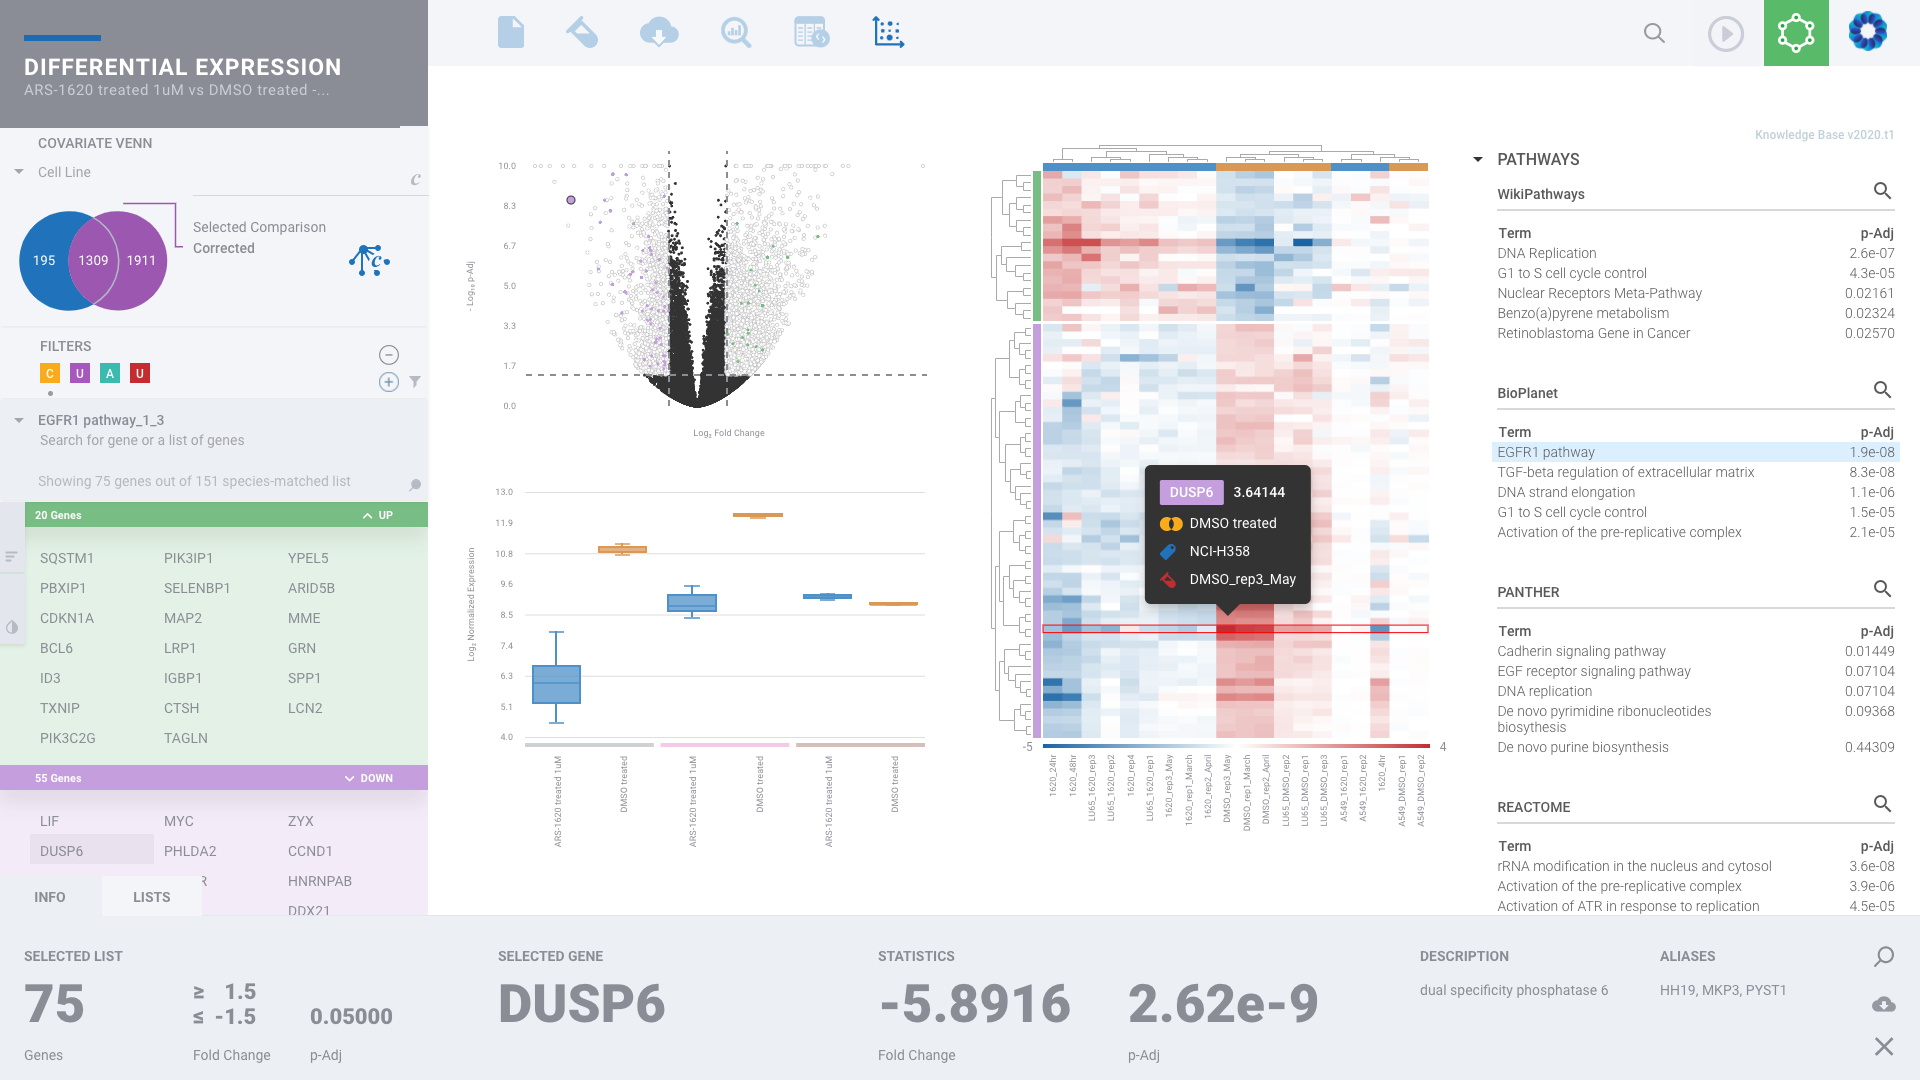
By accepting raw FASTQ sequence data as well as processed counts data, ROSALIND enables powerful downstream analysis and truly insightful visualizations of gene expression datasets. Seamlessly sift and sort through differentially expressed genes. Investigate top pathways, change cut-offs and validate gene signatures.
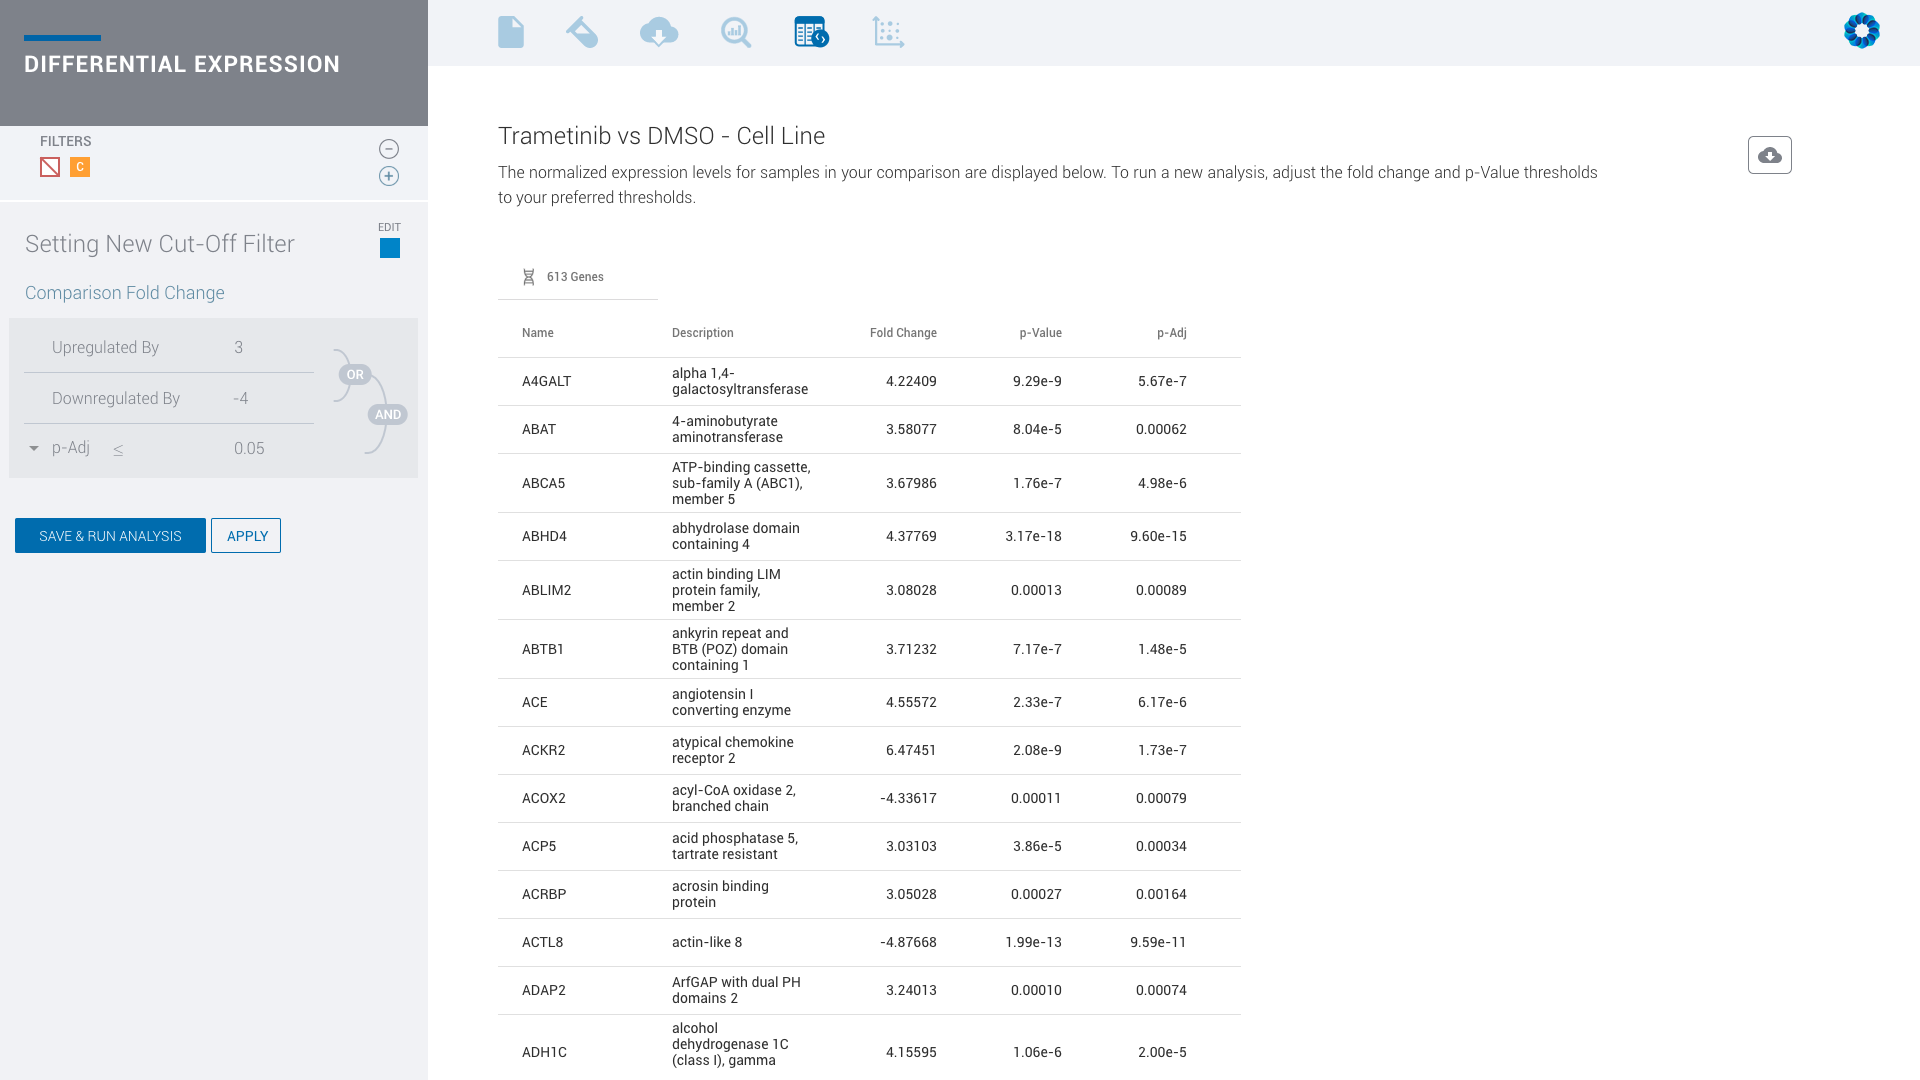
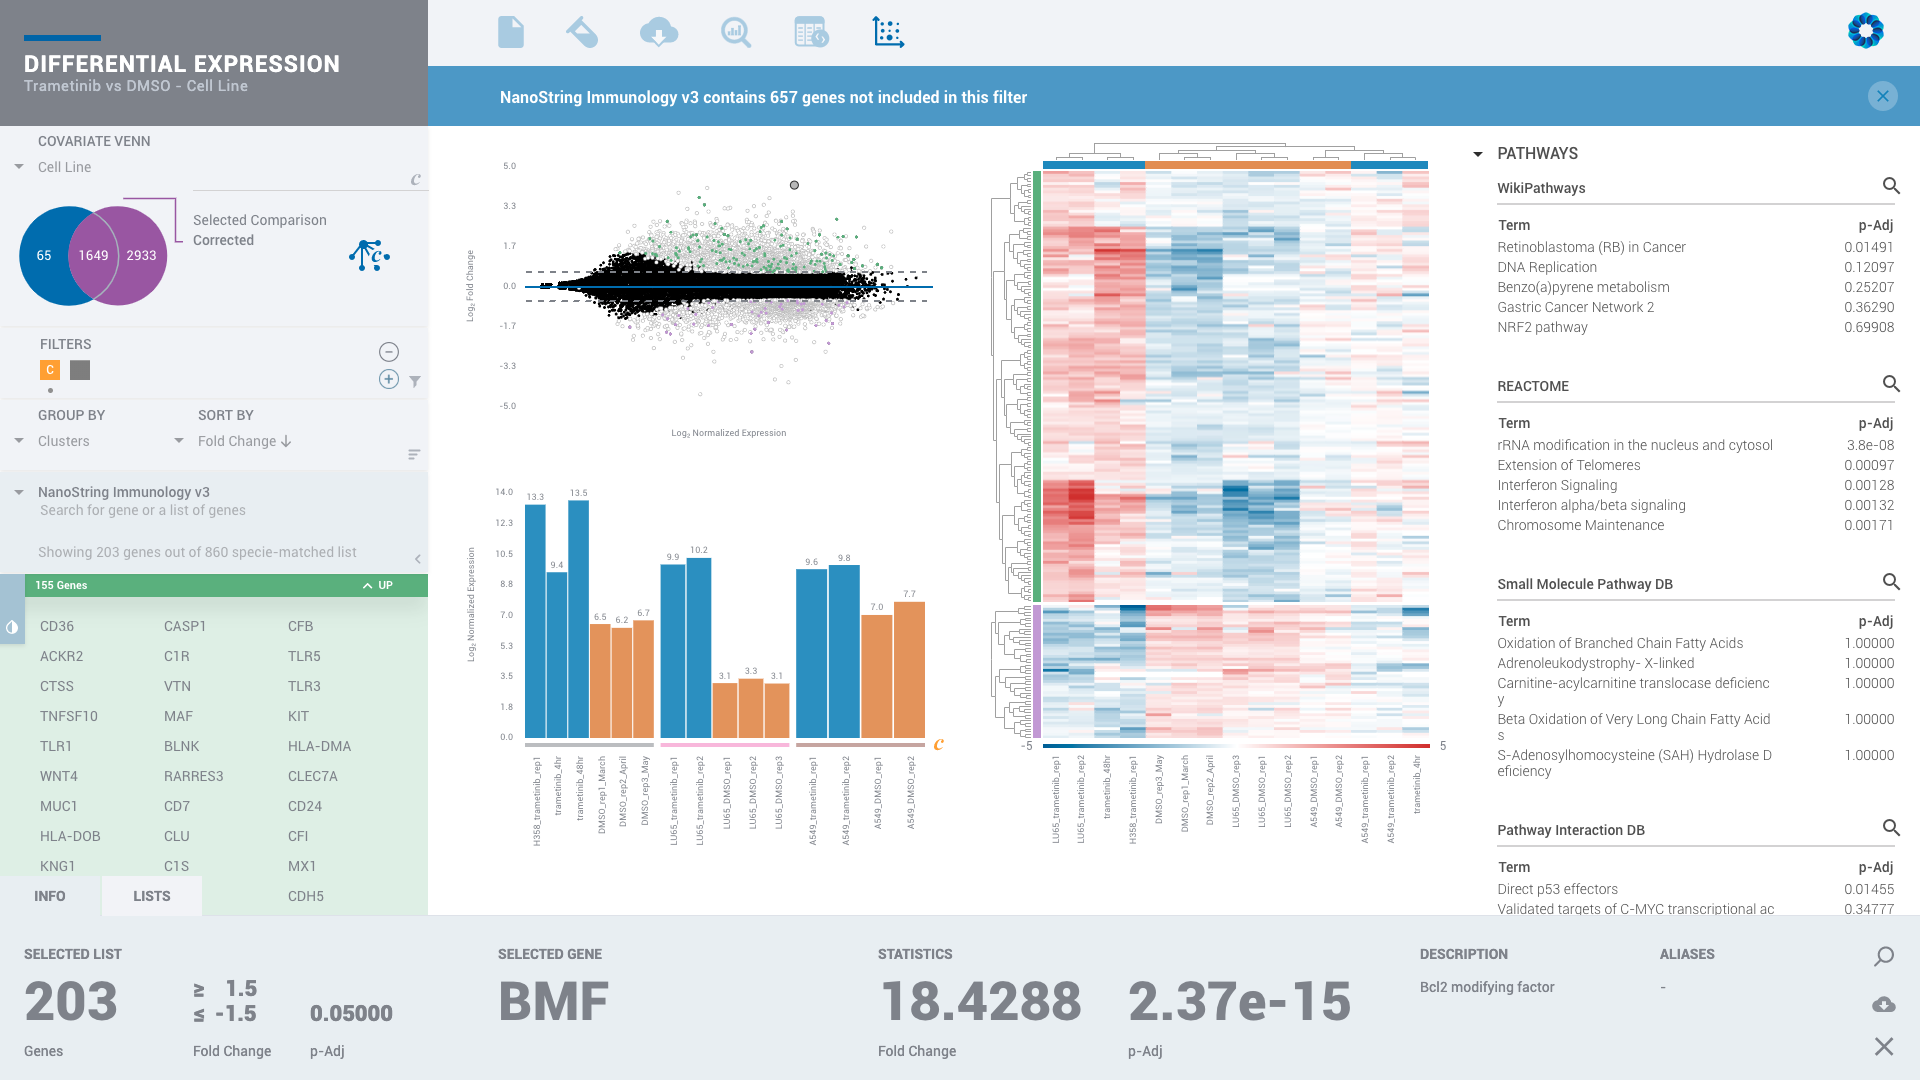
ROSALIND users can experiment with different cut-off values to update plots and explore updated interpretation of enriched genes. Set filter parameters for up-regulation, down-regulation and p-value. Customize plots & download publication-ready figures with clear explanations for every Scientist.
Create, collaborate and update gene lists so that you can discover and focus on the most important signatures across oceans of data. Each plot dynamically updates when a new list is selected.
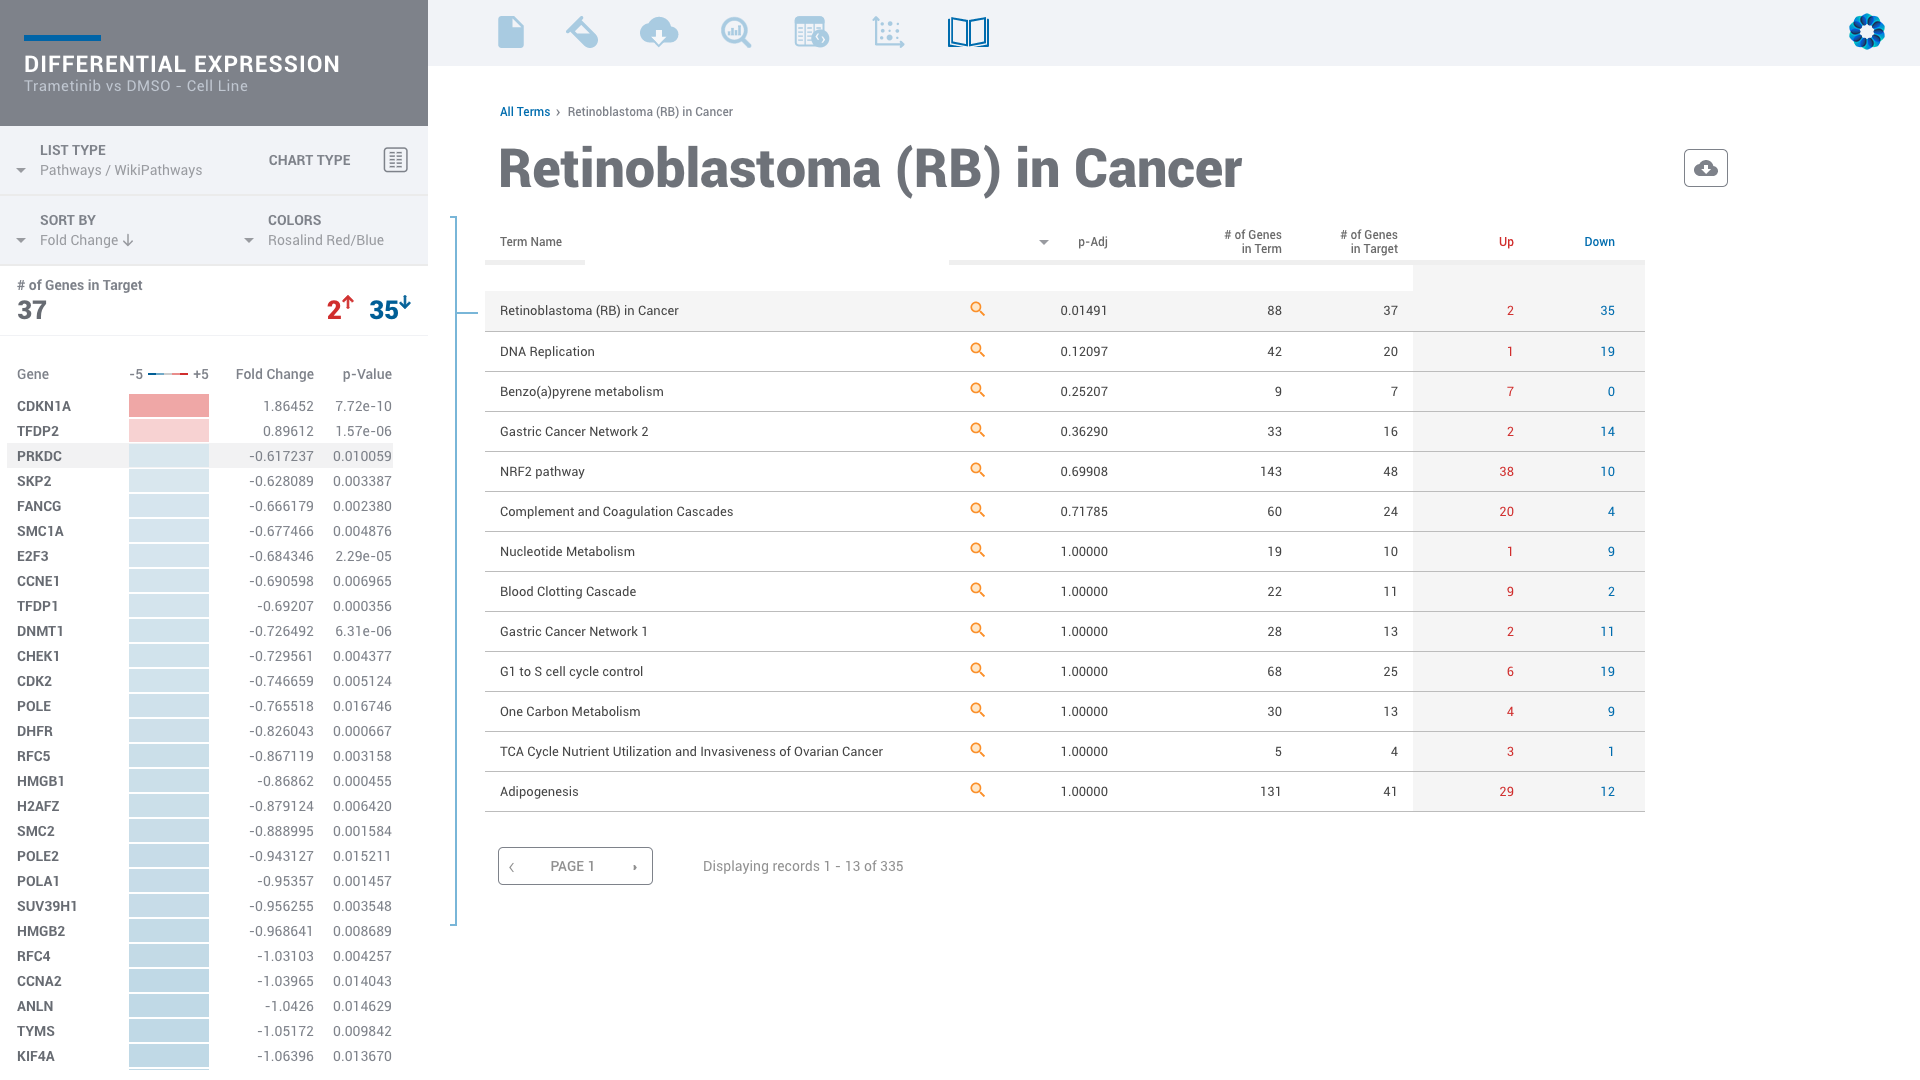
ROSALIND Knowledge Bases provide interpretation based on gene enrichment for each filter you create. Navigate the details of every term including Pathways, Gene Ontology, Proteins and many others. Experience pathway diagrams with detailed descriptions, annotated fold change colors, and gene heatmaps. Interact with the pathway diagram to see corresponding genes and access external references through the pathway magnifier.
Interested in Using ROSALIND to Analyze RNA-Seq Data?