Earlier this month, we launched NanoString Masterclass Series, designed to enhance scientific understanding and practical skills in advanced nCounter data analysis. Dr. Ryan Friese (VP of Rosalind Customer Experience) hosts the series to share his best practices from years of working hands-on with scientists in BioPharma and Academia as a Field Application Scientist for NanoString.

In our third session, Ryan, our resident expert, guided us through the crucial topic of Quality Control (QC) in gene expression analysis. Building on the foundation laid in the first two sessions, this session focused on the intricacies of QC, offering a comprehensive overview of its importance, the metrics involved, and the practical steps to ensure robust data analysis. Here’s a detailed recap of the key insights and takeaways from the session.
The Importance of Quality Control
Quality Control is the cornerstone of any reliable gene expression analysis. It involves a series of checks and metrics to determine which samples are suitable for inclusion and which should be excluded. The goal is to ensure that the data you analyze is accurate, thereby avoiding erroneous biological interpretations and conclusions. Ryan emphasized that understanding and correctly applying QC metrics gives you the confidence to make informed decisions about your data.
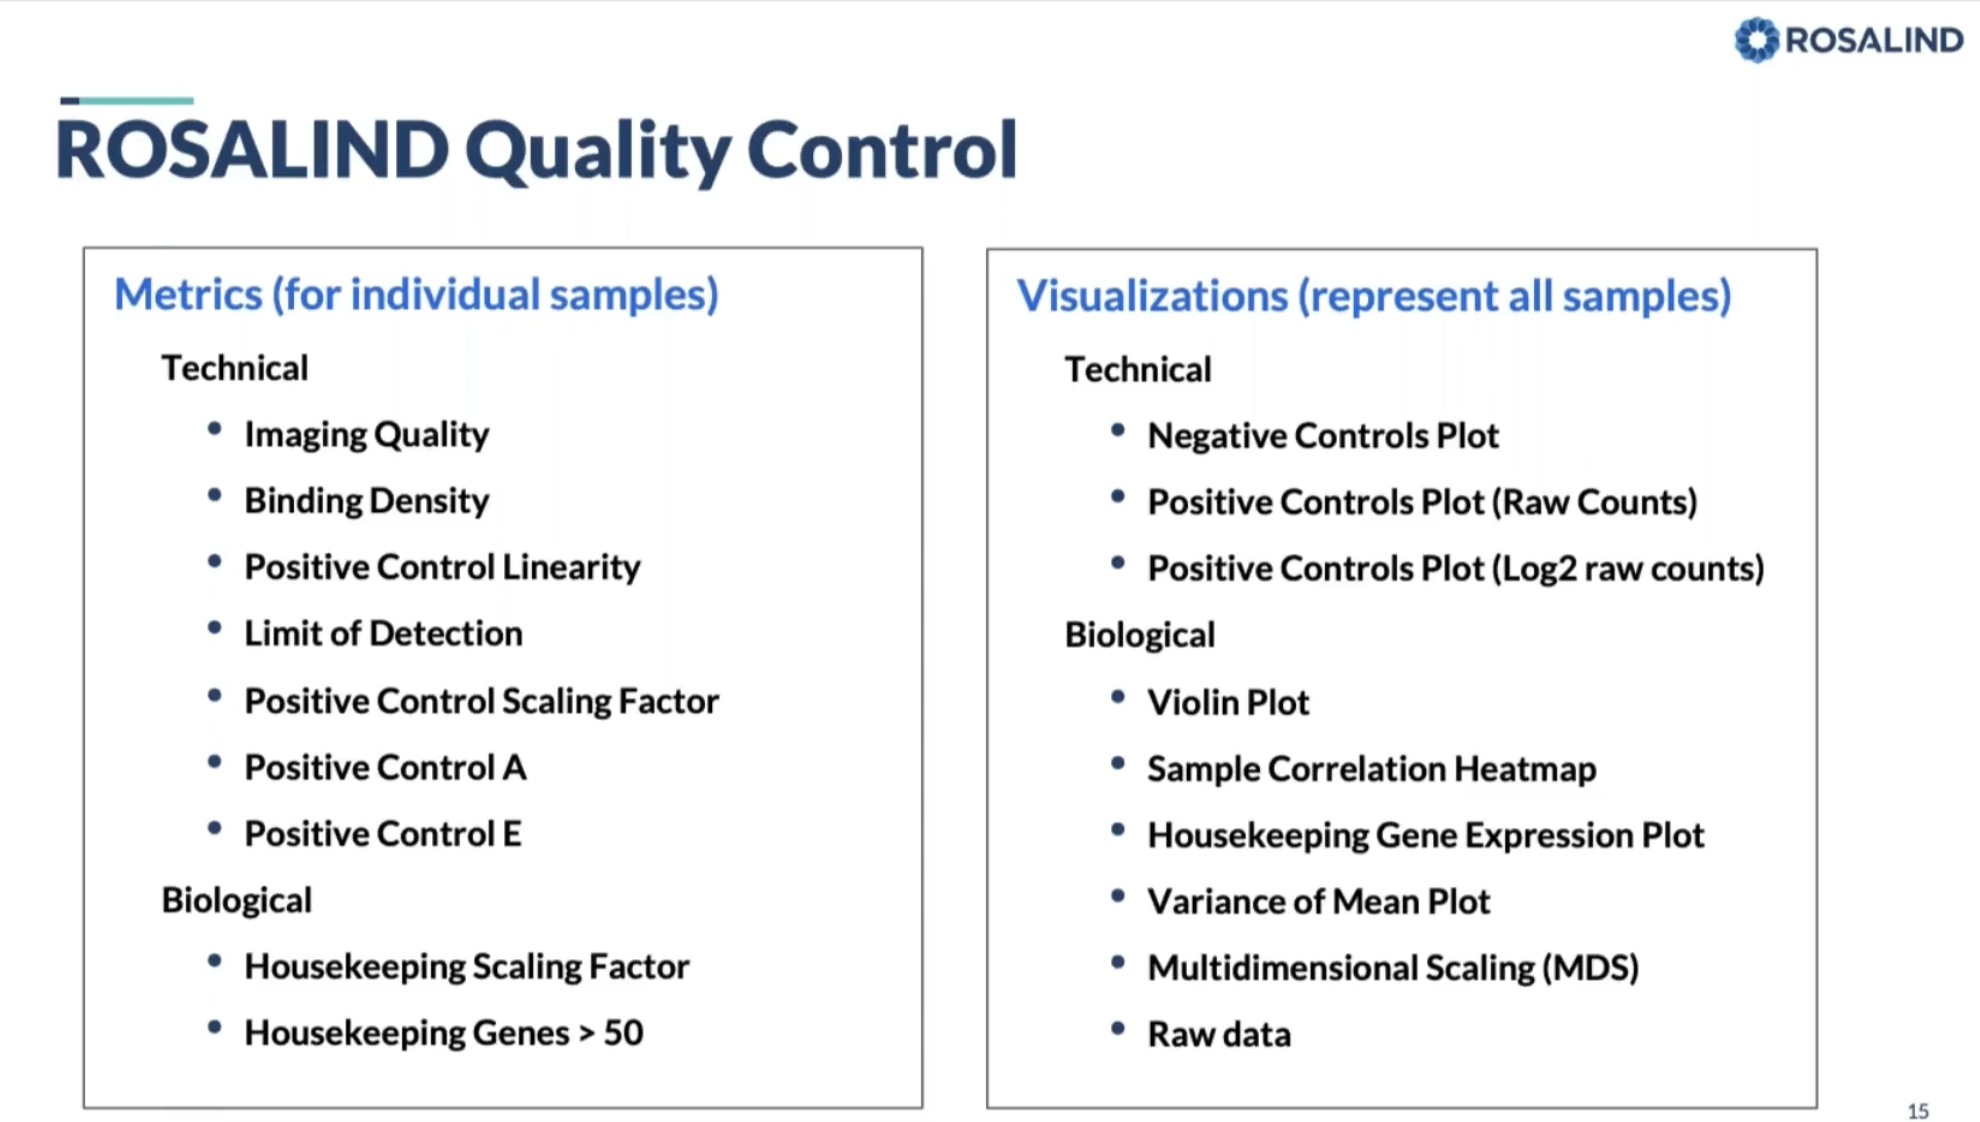
Key QC Metrics and Their Interpretation
Ryan broke down the QC process into manageable steps, each focusing on different metrics and their significance:
1. Imaging Quality:
- Purpose: Assesses the performance of the imaging process.
- Calculation: Ratio of fields of view (FOV) counted to FOV attempted. A flag is raised if this ratio is below 0.75.
- Importance: Ensures that the imaging process was successful, indicating the percentage of the surface area successfully scanned.
2. Binding Density:
- Purpose: Measures the number of barcodes bound to the imaging surface.
- Calculation: Count of fluorescent spots per square micron. Thresholds vary based on the instrument.
- Importance: Identifies potential issues with too many or too few barcodes, which could affect data accuracy.
3. Positive Control Linearity:
- Purpose: Evaluates the technical robustness and linearity of the assay.
- Calculation: Pearson correlation (R²) of the positive control concentrations versus their raw counts. A flag is raised if R² is below 0.95.
- Importance: Ensures the assay is performing linearly and consistently.
4. Limit of Detection:
- Purpose: Assesses the sensitivity of the assay.
- Calculation: Comparison of positive control E to the limit of detection derived from negative controls.
- Importance: Identifies any samples with low sensitivity, ensuring reliable detection of gene expression.
5. Housekeeping Genes > 50:
- Purpose: Evaluates RNA abundance and integrity.
- Calculation: Ratio of housekeeping genes with raw counts above 50 to the total number of housekeeping genes.
- Importance: Ensures sufficient RNA quality for accurate normalization.
6. Scaling Factors:
- Purpose: Compares the relative abundance of housekeeping genes and positive controls across all samples.
- Calculation: Ratio of the geometric mean of housekeeping genes or positive controls in each sample to the global mean.
- Importance: Identifies samples with outlier expression levels, impacting normalization and overall data consistency.
Practical Steps in QC Analysis
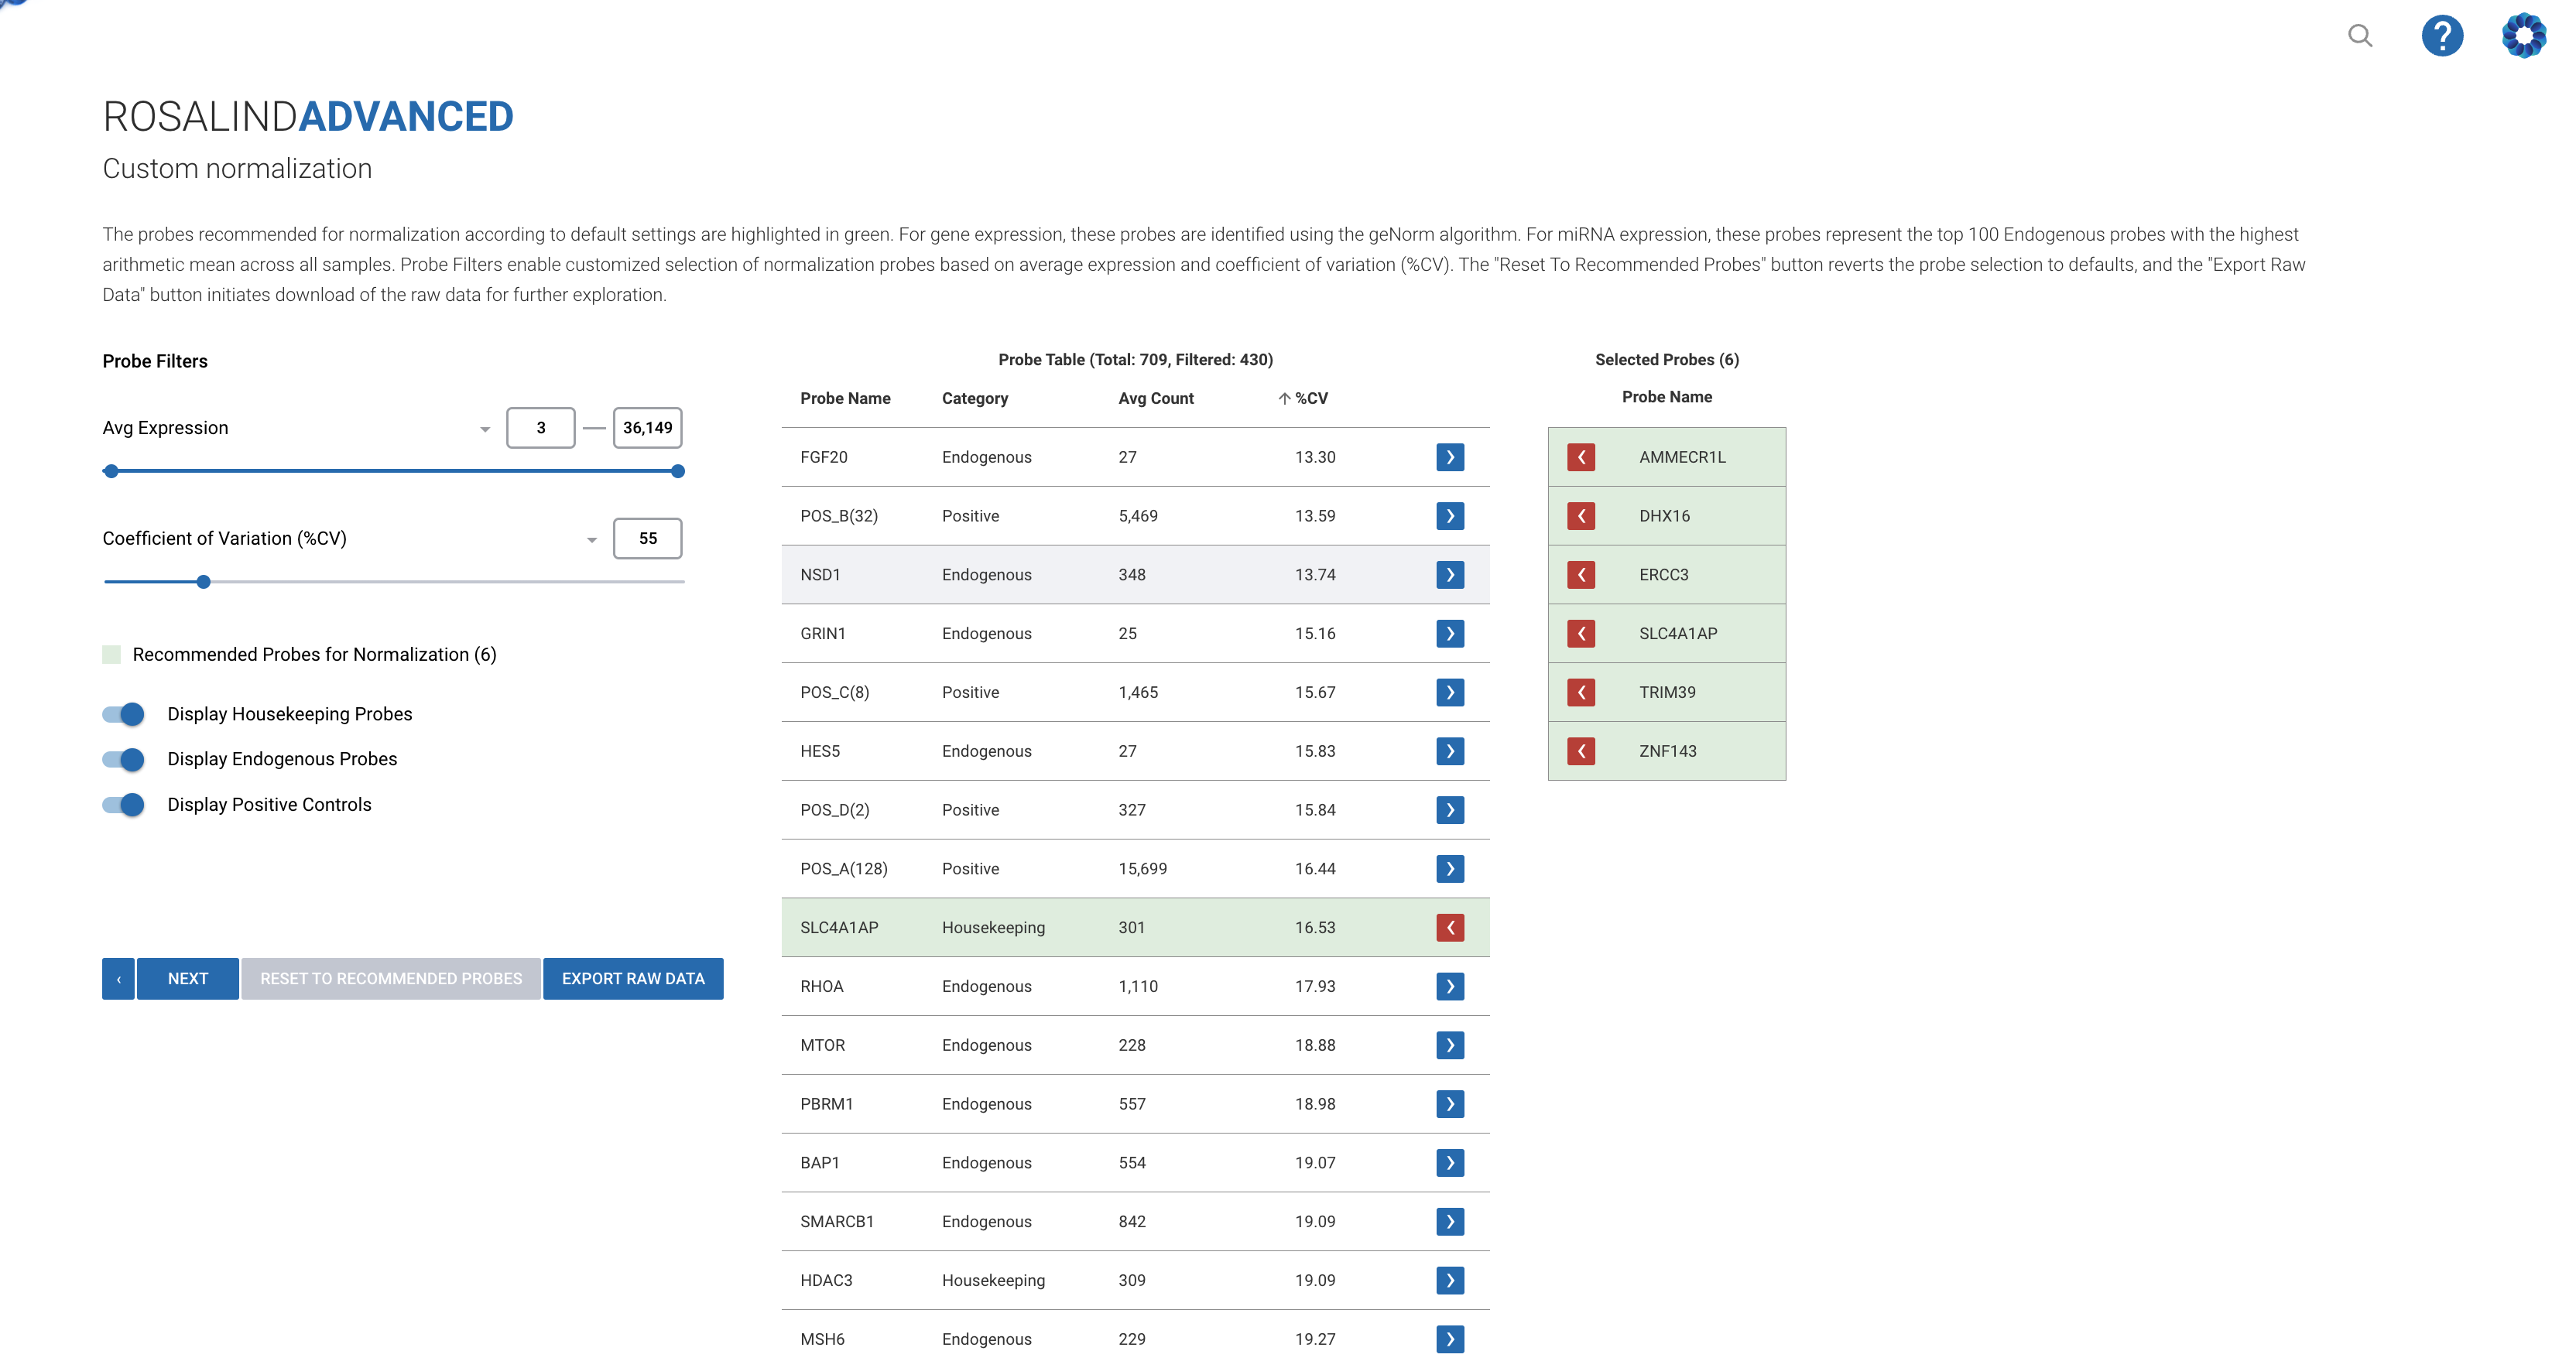
Ryan provided a logical progression for performing QC analysis in Rosalind NorthStar:
1. Initial Data Check: Always start by reviewing the raw data for any obvious issues with positive or negative controls.
2. Sequential Metric Evaluation: Follow a structured approach, beginning with imaging quality and moving through binding density, control linearity, and other metrics.
3. Visualizations: Utilize the various visualization tools in the platform to identify outliers and assess data quality at a glance.
4. Meta Analysis: Use meta-analysis to understand the impact of including or excluding specific samples, enhancing your data interpretation.
Conclusion
This session highlighted the critical role of QC in gene expression analysis, providing a detailed framework for evaluating and interpreting QC metrics. By following Ryan’s structured approach and leveraging the powerful tools in Rosalind NorthStar, you can ensure your data is reliable and your analyses are robust.Stay tuned for our next session on May 30th, where we’ll delve into Pathway Analysis. As always, recordings and resources from all sessions are available on our website. Thank you for joining us, and we look forward to seeing you in the next session!
Join the NanoString Masterclass Series
We are excited to continue this series with more in-depth explorations of other aspects of NanoString data analysis. Stay tuned for future sessions where we will cover topics like data integrity, scalability of experiments, and more.